
by Randall Bartlett
Over the past 30 years, health care spending in Canada has followed a pattern of peaks and troughs tied to overall economic activity and fluctuations in federal funding (see Chart A). Throughout this period, health spending varied significantly across provinces and territories. This has led to notable differences between actual expenditures and the notional health care costs derived from the macroeconomic fundamentals of population growth, aging, real income growth, and inflation. For instance, jurisdictions such as Newfoundland & Labrador and Quebec have maintained health spending below where the underlying cost drivers would suggest it should be. Meanwhile, most other provinces have spent more than these notional health costs would have warranted.

More recently, from 2010 to 2014, national health spending growth slowed relative to the previous decade, reaching an average annual pace of 3.4%. This pattern of weaker spending growth was observed in all provinces and territories. As such, it has allowed higher-spending provinces to close some of the gap between annual spending and notional health care costs. But, while restraint was exercised across most expenditure categories, capital investment has borne the brunt of the adjustment, contracting by an average of -1.3% annually. This was underpinned by declines in average annual capital spending in Prince Edward Island (-21.0%), Nova Scotia (-14.1%), Alberta (-11.5%), Manitoba (-5.3%), New Brunswick (-3.6%), Ontario (-3.1%), British Columbia (-1.7%), and Newfoundland & Labrador (-1.2%) over this period. The contraction in spending on capital is particularly concerning as some of these provinces continued to further restrain investment in 2015 and 2016, meaning these provinces may be just ‘kicking the can down the road’ by deferring investment today at a higher cost in the future. In contrast to these provinces, the territories have managed to buck this trend, with Nunavut (45.9%), the Northwest Territories (24.1%), and the Yukon (17.1%) all experiencing double-digit average annual growth in capital expenditures from 2010 through 2014. Quebec (5.6%) and Saskatchewan (4.9%) also increased capital investment over this period.
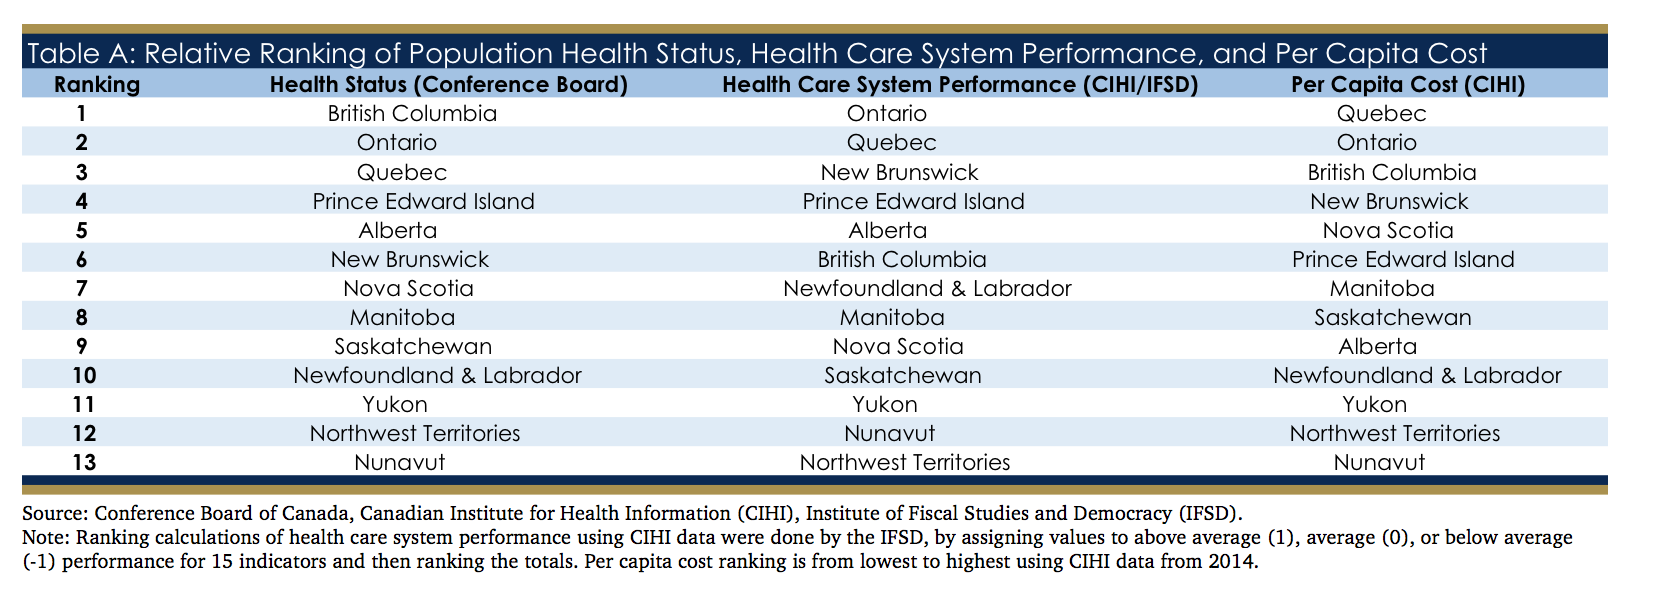
Looking to total health care costs on a per capita basis, Quebec, Ontario, and British Columbia are at the top of the leaderboard, and are the only provinces with spending below the national average (see Table A). At the other extreme are the territories, whose per capita health spending is multiples higher than the national average. But cost is only one consideration when evaluating health outcomes. Looking to health care system performance among the provinces and territories, Ontario and Quebec yet again lead the pack, while the territories continue to lag their provincial counterparts. The results are similar when comparing the health status of the respective provincial-territorial populations, with some minor reshuffling of the relative ranking, notably for British Columbia and New Brunswick.
 In 2015, the Council of the Federation called on the federal government to commit to maintaining a 25% participation in provincial health care expenditures (excluding transfers from the equalization program). In order to meet this request, the provinces and territories asked the federal government to commit to grow the Canadian Health Transfer (CHT) by 5.2% annually. Instead, the Government of Canada decided to move forward with an increase in the CHT tied to the pace of nominal GDP growth. An additional commitment of $11.5 billion was promised over 10 years for federal health priorities, namely mental health and home care, although much of this additional health funding is back-end loaded to the end of the 5-year budget planning horizon. To date, all provinces have agreed to this offer, with the exception of Manitoba.
As a result of this agreement, the federal share of national health spending will rise over the next few years as fiscal restraint among provinces and territories continues. However, as the underlying cost pressures keep rising due to the macroeconomic cost drivers, the Institute of Fiscal Studies and Democracy (IFSD) is forecasting a gradual decline in the federal share of health spending (see Chart B). Indeed, by 2026, the federal share of health expenditures will have fallen below its current level. And if health spending restraint is relaxed, the federal share will fall even further.
 Notably, if federal health funding were to increase at an average annual pace of 5.2% over the next five fiscal years, the provinces and territories would receive an additional $5.2 billion in total federal support for their health care systems (see Chart C). When examined over the next decade, the gap increases to a cumulative $33.5 billion. As Canada’s most-populous province, Ontario will see the total amount of federal support for its health care system be the most negatively impacted as a consequence of accepting the federal government’s recent offer. The federal health funding gap for Ontario equates to a cumulative $2.0 billion and $12.9 billion in the 2017 to 2021 and 2017 to 2026 periods, respectively (see Chart D). The size of this gap is then followed, in descending order, by Quebec, British Columbia, and Alberta.


In summary, while additional federal funds dedicated to home care and mental health will provide modest support to provincial finances, this agreement is neither sufficient nor transformative in helping the provinces to meet the health care needs of their citizens. And given the back-end loaded nature of additional health funding, the more paramount concern is that health care reforms have been largely deferred to beyond the 2019 election