
Major budget documents usually dedicate a section to the debt management and borrowing strategy of the federal government. And while those pages usually do not make headline news like the major policy announcements and bottom-line deficits, they are of tremendous importance. The financial markets’ community, and taxpayers in general, can find useful information in that such a section about how the government borrows money to finance its budgetary balance, non-budgetary transactions and maturing pre-existing debt stock. In Budget 2018, while no major changes were brought to debt management objectives, several changes in their implementation going forward are worth highlighting.[1] Most importantly, the reference to “an increased focus on the issuance of short- and medium-term bonds (2-, 3- and 5-year maturities)” has been dropped. Therefore, in the coming fiscal year, the issuances of bonds will be reduced while the issuances of treasury bills will increase. In the near term, this will have an impact on the supply of those various types of Government of Canada securities available for sale. In the medium term, those decision, keeping everything else constant, will also have important fiscal implications through higher public debt charges (PDC).
Fewer Bonds…
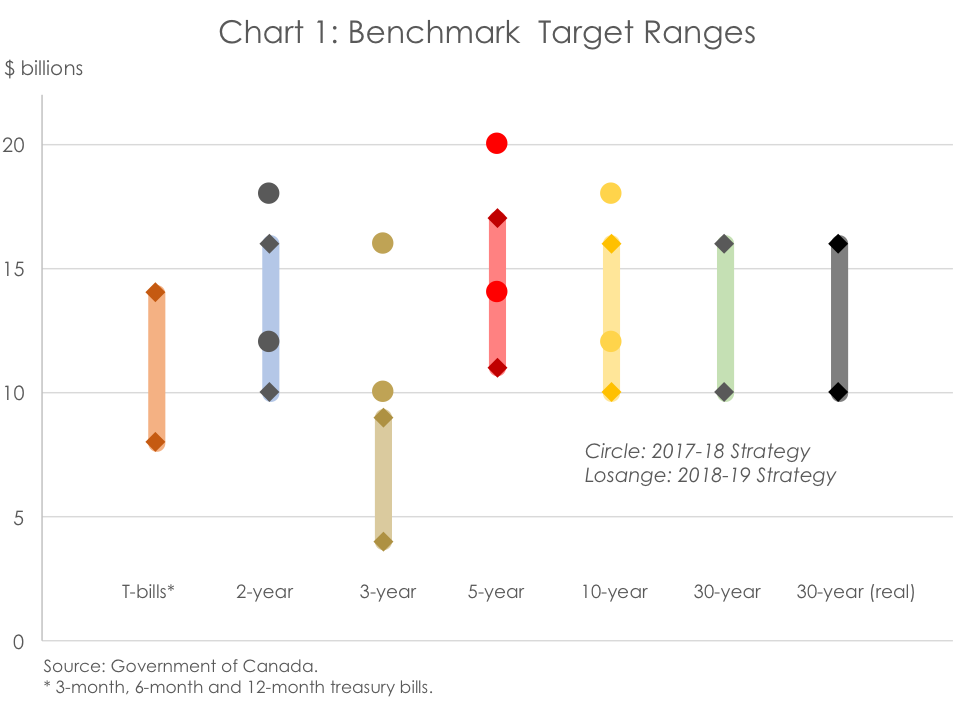
First, after having increased for the last two years, nominal bonds issuances will decline by $23 billion, from $138 billion in 2017-18 to $115 billion in 2018-19.[2] Practically, this will be implemented through the reduction of benchmark bonds target ranges (Chart 1). The most important decline in benchmark target ranges occurs at the 3- and 5-year tenures, while the 2- and 10-year volume benchmark targets are also being reduced. This will be implemented with the same number of bond auctions across the whole bond yield curve except at the 3-year level which is to be reduced by 2, from 8 to 6.
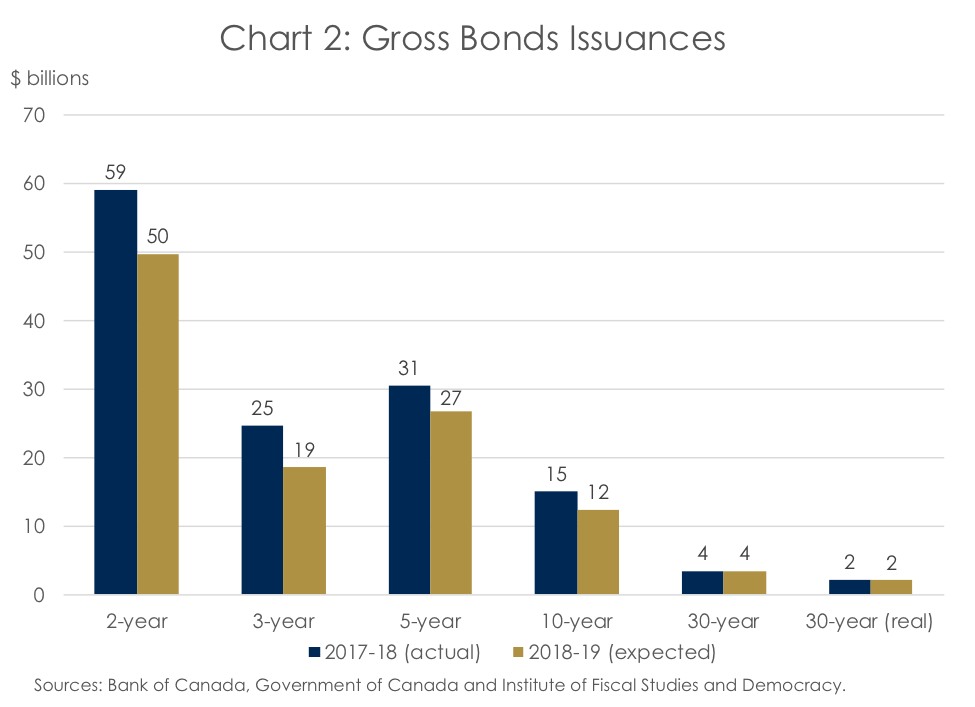
Consequently, using the planned numbers of bond auctions, the average of the benchmark ranges as actual targets, and a $113 billion bonds financing schedule[3], we estimate the issuances of 2-, 3-, 5- and 10-year bonds to fall by $9B, $6B, $4B, and $3B, respectively.[4] The resulting volume of issuances at these respective yields is expected to be $50B, $19B, $27B, $12B, $4B and $2B (Chart 2).
… But More Treasury Bills
The supply of treasury bills in 2017-18 is short of the Government’s expectations: $125B versus $131B expected in Budget 2017. That is because an improved revenue outlook stemming from stronger-than-expected economic growth has reduced borrowing requirements. Lower borrowing requirements in turn are absorbed in the near term through smaller treasury bill issuances. The latest comments from the debt management strategy consultations revealed that market participants believe that the outstanding stock of treasury bills is approaching “a level below which the well-functioning of the treasury bill market could be impacted” and that “demand for very short-term product (…) currently outpaces supply.”
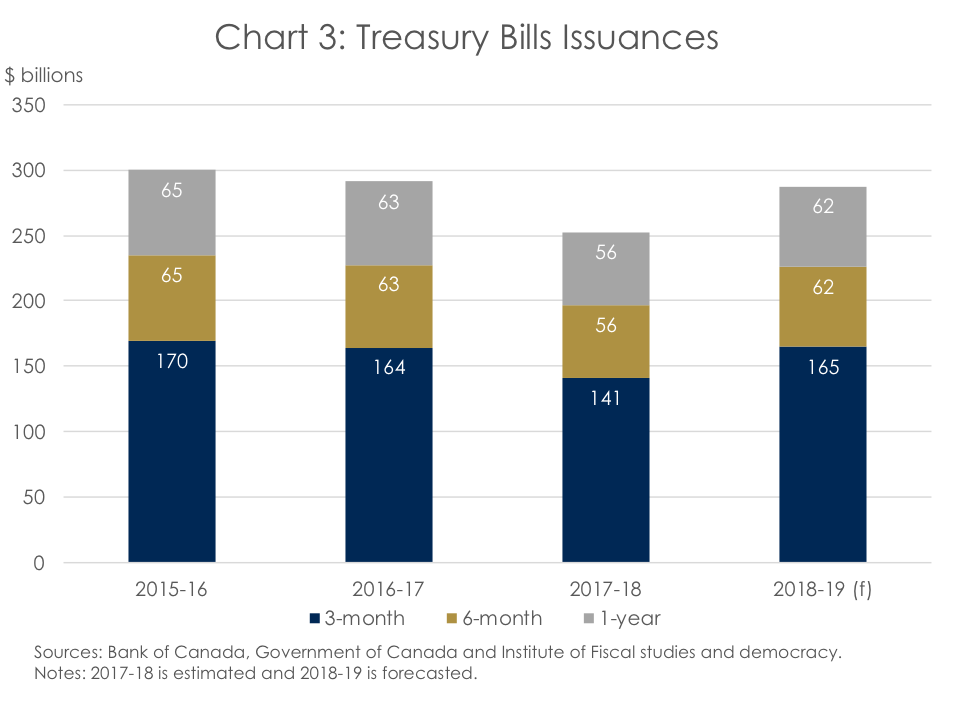
To increase the 2018-19 year-end supply of treasury bills to $138 billion, we estimate that a 3-, 6-, and 12-month treasury bill issuance program of around $300 billion will be necessary (Chart 3).[5] Since regular treasury bill auctions will continue to be held bi-weekly, the targeted average benchmark size for treasury bills will have to increase.[6]
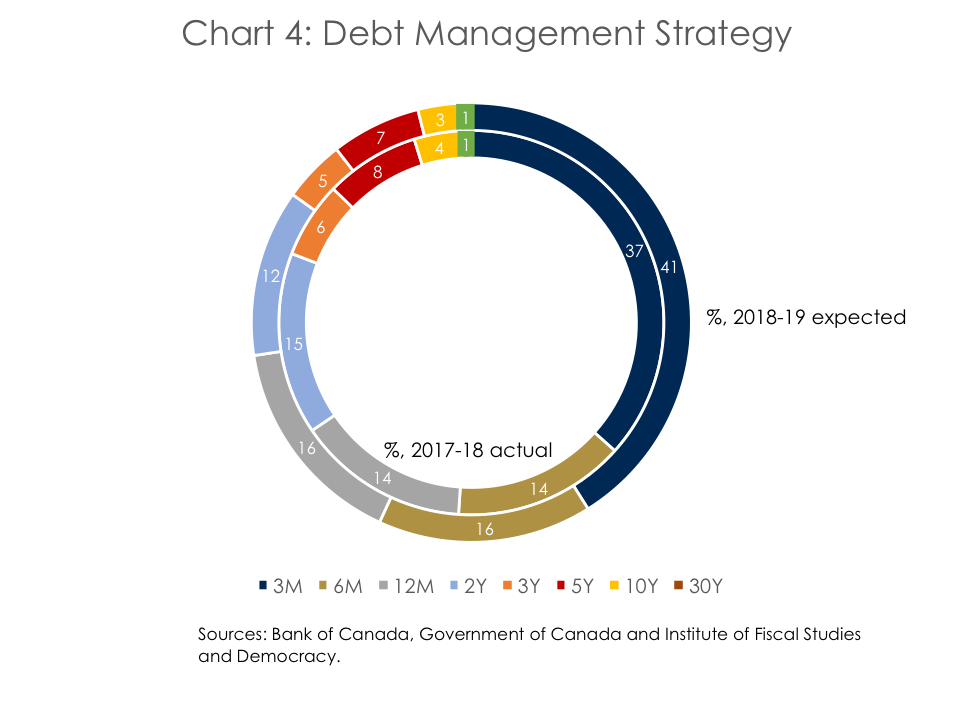
Overall, the debt management strategy inferred from Budget 2018 is different than what was expected in early February and what was implemented in the 2017-18 fiscal year (Chart 4).
Implications for the Federal Fiscal Forecast
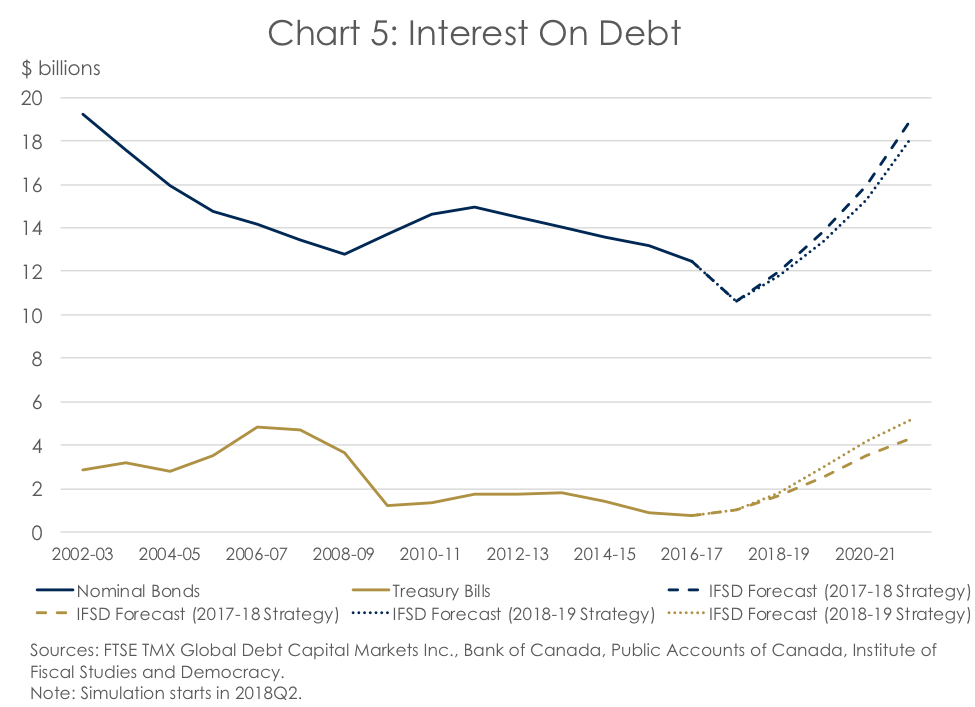
Next, using our inferred debt management strategy for the 2018-19 fiscal year, as well as the primary balance and the yield curve forecasts out of our March 2018 economic and fiscal forecasts, we estimate public debt charges (PDC) on nominal bonds and treasury bills. Using the same methodology as described in February, prior to Budget 2018, PDC on nominal bonds and treasury bills are expected to increase from $12.5 and $0.7 billion in 2016-17 to $21.4 and $6.3 billion in 2022-23, respectively (Chart 5). This will represent 1.1% of GDP, up from 0.7% in 2016-17.
These PDC are higher than what one would obtain by using a strategy similar to the one used in the 2017-18 fiscal year e.g.–– increasingly focused on medium-term nominal bonds. For instance, by the end of the forecast, PDC for nominal bonds are $1.1 billion lower and treasury bills are $1.0 billion higher under the projected 2018-19 fiscal year debt management strategy than under a simulation that uses our estimate of the fiscal 2017-18 strategy for fiscal 2018-19. Indeed, the higher allocation of funding requirements to treasury bills explain the larger PDC on them. As well, since January 2018, the yield curve has moved higher, increasing the costs of debt across all tenures. Moreover, as a larger share of funding requirements need to be rolled over more quickly, the issuances of nominal bonds has also increased, thereby inflating coupon payments on the latter.[7] But, since the overall allocation to bonds has shifted down, their overall costs end-up slightly lower by the end of the forecast.
While this outlook is helpful in understanding implications of the change in the federal government’s debt management strategy, any medium-term assessment using the approach outlined above is subject to some important caveats:
- The debt management strategy used in the simulation is fixed. In practice, it changes every year, and within the year, subject to market conditions and the state of the economy.
- Assuming the same strategy (as in 2017-18) going forward implies a lower share of treasury bills being issued and that are available for sales in the secondary market. As highlighted above, this could disrupt the proper functioning of the market for Government of Canada treasury bills. A higher bid-ask spread or some difficulties for traders to move large blocks of treasury bills due to insufficient liquidity could, in the end, increase the costs for the government to issue debt. The latter result would offset gains (savings) from issuing more bonds and insulating PDC from higher rates.
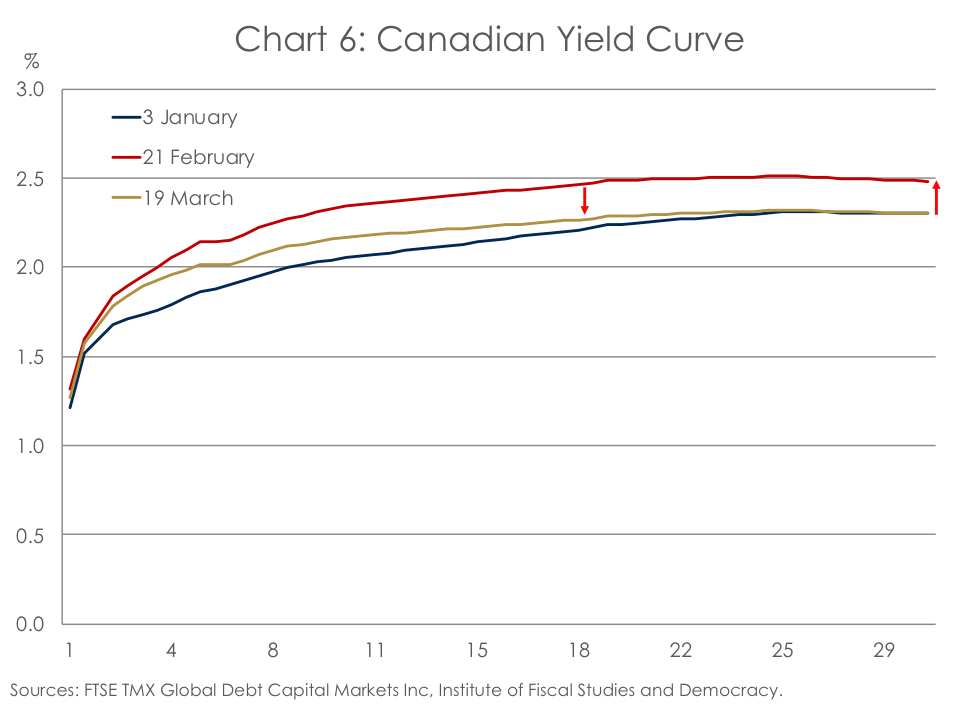
In conclusion, recent developments in the last month lead us to believe that interest rate risks have temporarily receded. As highlighted in our latest economic outlook, global momentum is still strong but early signs of a cooling are beginning to appear, especially in the goods-producing sectors in developed markets. In Canada, three interest rate hikes in less than a year have started to hinder growth coming out of highly indebted household, with real GDP growth slowing down significantly in the second half of 2017. Add to that the numerous downside risks related the NAFTA negotiations, oil prices, and the housing market, and financial market expectations for rate hikes this year have faded out, as have interest rates on bonds at all maturities (Chart 6). However, should those risks to the Canadian economic outlook recede, market interest rates would undoubtedly be back on the rise.[8] In that context, treading cautiously on both fiscal and debt management is still very warranted.
Disclaimer
FTSE TMX Global Debt Capital Markets Inc, FTSE International Limited, the London Stock Exchange Group companies or TSX INC. (“TSX” and together with FTDCM, FTSE and the Exchange, the “Licensor Parties”). The Licensor Parties make no warranty or representation whatsoever, expressly or impliedly, either as to the results to be obtained from the use of Canada yield curve (“the Index”) and/or the figures at which the said Index stands at any particular time on any particular day or otherwise. The Index is compiled and calculated by FTDCM and all copyright in the Index values and constituent lists vests in FTDCM. The Licensor Parties shall not be liable (whether in negligence or otherwise) to any person for any error in the Index and the Licensor Parties shall not be under any obligation to advise any person of any error therein. “TMX” is a trade mark of TSX Inc. and is used under licence. “FTSE®” is a trade mark of the FTSE International Limited in Canada and is used by FTDCM under licence.
[1] The objectives are 1) raising stable and low costs funds and 2) maintaining a well-functioning market for Government of Canada securities.
[2] This represents the gross amount which includes inflation adjustments expected for real return bonds and scheduled switch buybacks.
[3] Excluding switch buybacks and inflation adjustment. See Table A3.1 of the Debt Management Strategy.
[4] The exact amount calculated using this methodology is proportionally adjusted downward to match the exact amount of $113B. In practice, the Bank of Canada might also target bond benchmark sizes slightly lower than the average of the target ranges.
[5] The projected $138 billion includes cash-management treasury bills but the regular, 3-, 6-, and 12-month issuance program does not.
[6] The projected benchmark size for treasury bill is unchanged (Chart 1) but its $8 billion to $14 billion range gives the Bank of Canada much flexibility in its implementation.
[7] Indeed, the model distributes all funding requirements from maturing securities and the primary account balance according to the strategy. This is a departure from actual practices where treasury bills are replaced upon maturing with other treasury bills.
[8] See our latest economic outlook for more details on the interest rate path and the potential risks to Canada’s economy.