
After a stellar December employment report published by Statistics Canada last Friday, an interest rate hike by the Bank of Canada (BoC) at next Wednesday’s fixed announcement date is widely anticipated by both financial market participants and economists. The BoC’s Winter 2018 Business Outlook Survey (BoS) published yesterday reinforced that view.
The Institute of Fiscal Studies and Democracy (IFSD) is also of the view that the Bank of Canada will raise interest rates next week. For instance, the BoS gave important information about labour market unused capacity (“slack”)[1] in Canada, a subject of much debate in the last couple of months. Indeed, yesterday’s BoS showed that 46% of firms in the country experience more intense labour shortages than a year ago, just a hair lower than this statistics’ highest point on record in 2007Q1 (48%). Hence, an increasingly tight labour market is the most commonly-cited reason of intensifying capacity pressure in the economy, as per the Winter 2018 BoS. This, combined to other positive economic indicators, should be enough to change the Governing Council’s view on labour market slack.
But what if recent labour market data isn’t enough to budge the Bank?
Since the Canadian economy started to recover and complete its “adjustment” following the oil price shock of 2014-2015, “slack” in the labour market has been consistently highlighted by the BoC in its interest rate announcements.[2] Last fall, the importance of labour market unused capacity has been discussed in the most recent Monetary Policy Report and various speeches and appearances in Parliament. The youth participation rate, one of those indicators, is also one of the things keeping Governor Poloz awake at night.
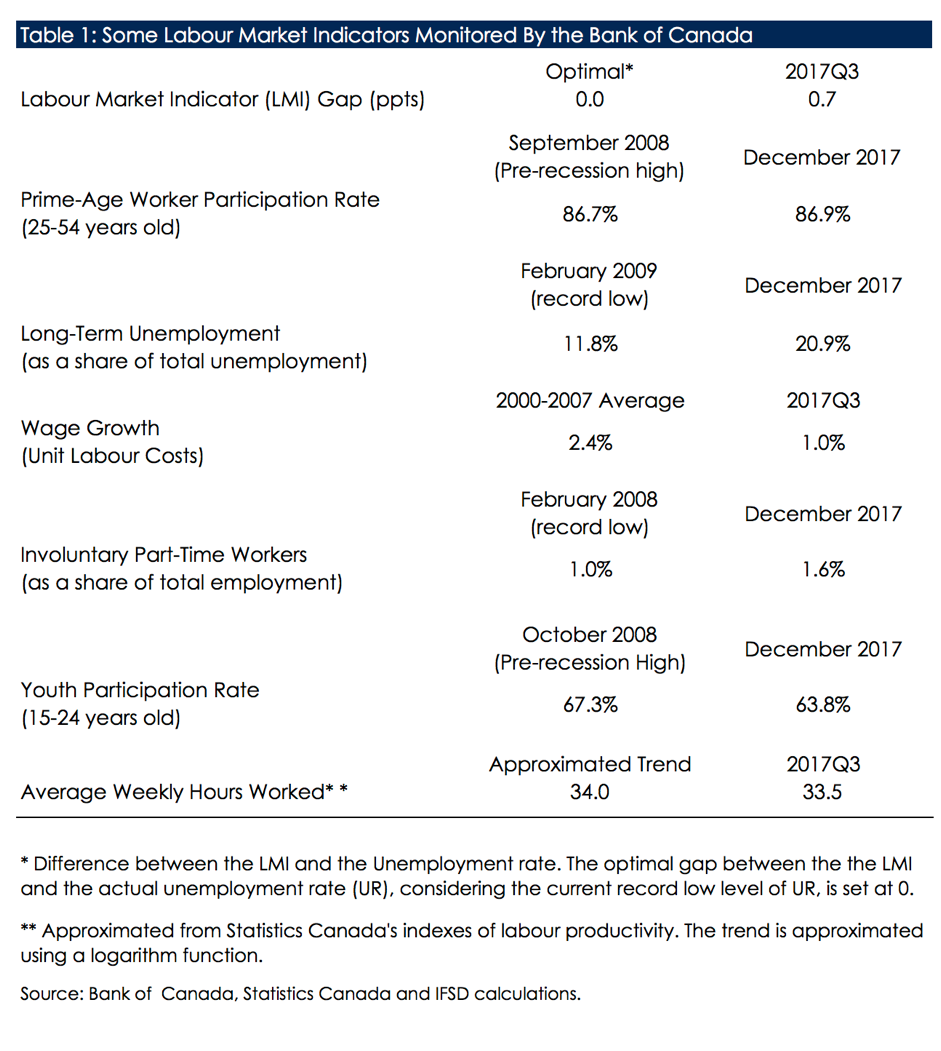
Henceforth, focusing only on the labour market indicators that have been mentioned by the BoC in recent communications – the BoC’s Labour market indicator, prime-age worker’s participation rate, long-term unemployment, unit labour cost, involuntary part-time workers, youth participation rate and average hours worked – Governor Poloz would conclude that, despite some moderate improvement, unused capacity still exists. In fact, by comparing the most recent data point to either pre-recession levels or record measurements, only one of those indicators – prime-age worker’s participation rate – has fully recovered following the 2008-09 recession (Table 1 below).
That’s why, in the IFSD’s view, if one would strictly follow the communication lines emboldened by the BoC in recent speeches and Monetary Policy Reports, the roughly 85% market-based odds of an interest rate hike by the Bank of Canada next week are likely overstated. The fact that, in October, real GDP growth in 2017Q4 was forecasted by the BoC to be 2.5% annualized, while the IFSD’s internal nowcast of real GDP growth points towards 1.8-2.0% further reinforces that view.
The following charts explain in more details each indicator included in Table 1.
- Labour Market Indicator
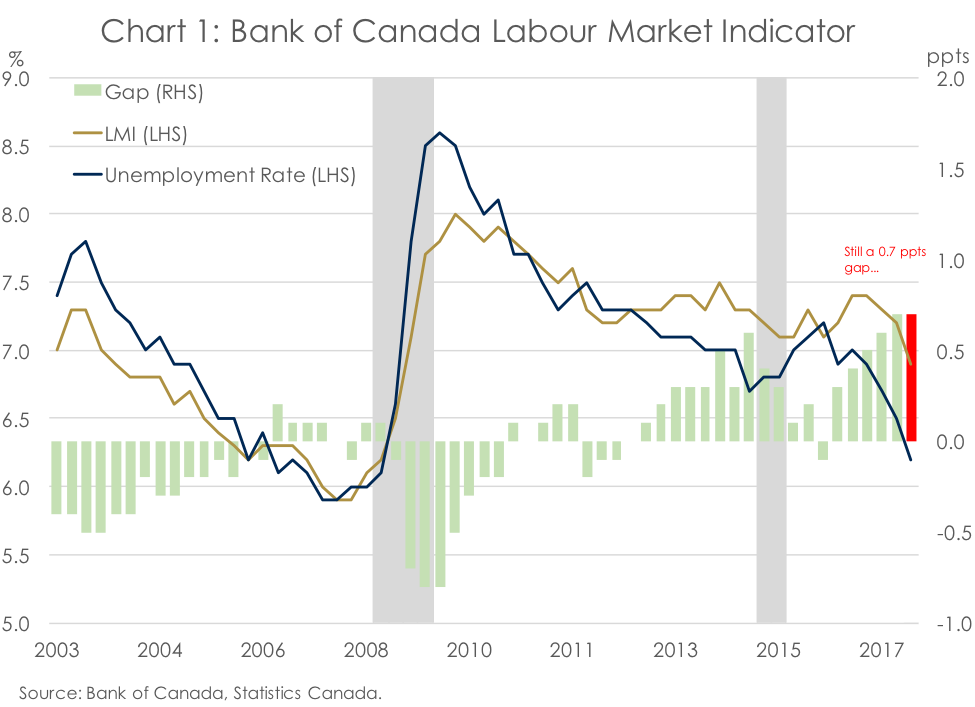
The labour market indicator (LMI) is one of the capacity and inflationary pressure indicators used by the BoC. One advantage of the LMI is to provide a broader picture of the Canadian labour market than the traditional unemployment rate. Indeed, while the unemployment rate is a “picture” of the relative number of people actively looking for work, it does not account for other important factors making up labour markets. For instance, how many people are flowing in and out of unemployment each month, how many people are participating in the labour force, how many hours do they work, etc.[3] Therefore, a gap between the LMI and the unemployment rate generally represents additional “slack” in the labour market that is not captured solely by the latter. And, indeed, while both measures have been improving since the second half of 2016, the gap between both measures has been increasing (Chart 1). This additional slack is due, in part, by the incidence of long-term unemployment, weak wage growth and low average hours worked.
- Prime-Aged Workers Participation Rate
Prime-aged workers consist of the population between 25 and 54 years old. They are usually the ones more likely to work and be in their most productive years, thereby forming the backbone of the labour market. As the population continues to age and the dependency ratio e.g. the proportion of people aged 65 years old relative to those aged 25-to-64 years old – increases, pressure to work for prime age women and men will augment, all else equal. Of course, that is based on the assumption that technical skills needed by employers are aligned to those offered by potential employees and, also, that willingness to work stays the same.
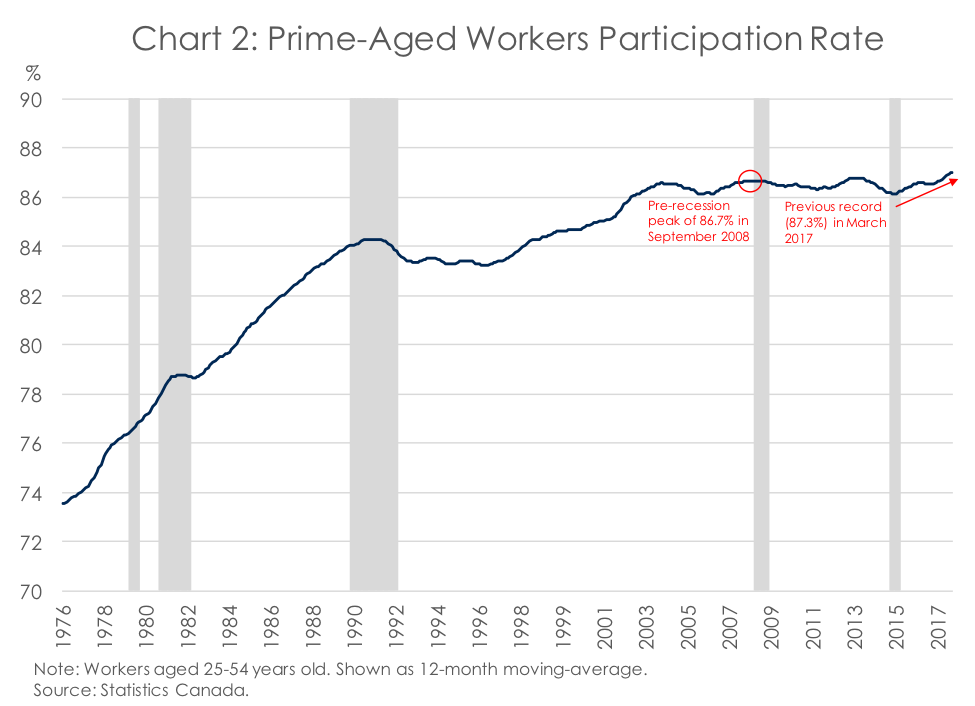
The prime-aged worker participation rate briefly fell in the middle of 2010, before rebounding to an all-time high at 87.1% in December 2012. That record was overstepped in March of last year, at 87.3%. It was still firmly trending up as of December 2017 (Chart 2).
- Long-Term Unemployment
Unemployment is comprised of two groups – short-term unemployed (those recently became unemployed) and long-term unemployed. In long-term unemployment resides potential workers that are at risk of dropping out of the labour force altogether, which would be a net loss for society. In economics, long-term unemployment is generally considered a detriment to the worker’s potential employability due to loss of skills, disinterest in the labour market or the potentially negative signal that sends a long period of unemployment on a resume.
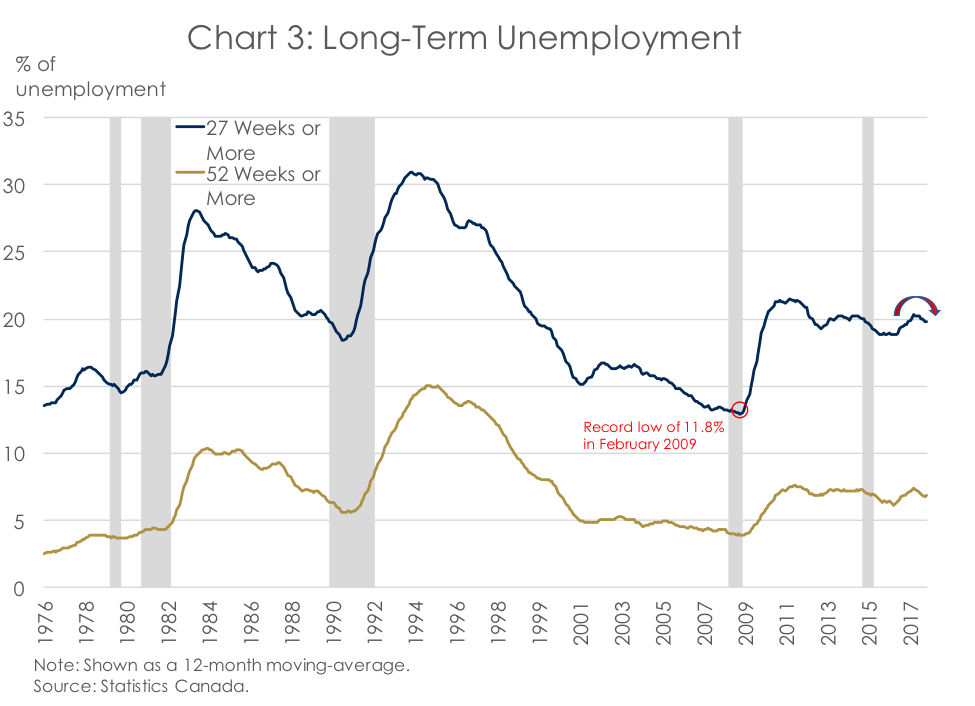
Several measures of long-term unemployment exist but the Bank of Canada is focused on women and men who have been unemployed for six months (27 weeks) or more.[4] In Canada, following the 2008-09 recession, long-term unemployment rose by a wide margin. Similar to previous cycle, it then entered a slow but steady progress towards normalization. However, due to the oil price crisis of 2015, long-term unemployment went up again. It only recently made some progress down in the wake of a very strong job market in 2017 (Chart 3).
- Wage Growth
Wage growth is a reflection of the degree of labour market slack. However, there is currently a raging debate within economic circles about whether the relationship between the unemployment rate and wage inflation still holds, as wage growth has remained muted while unemployment rates have continued to fall. For example, in the United Kingdom, the unemployment rate sits at a 42-year low of 4.3%. And while inflation is at 3.1%, wage growth was only 2.3% in November of 2017.
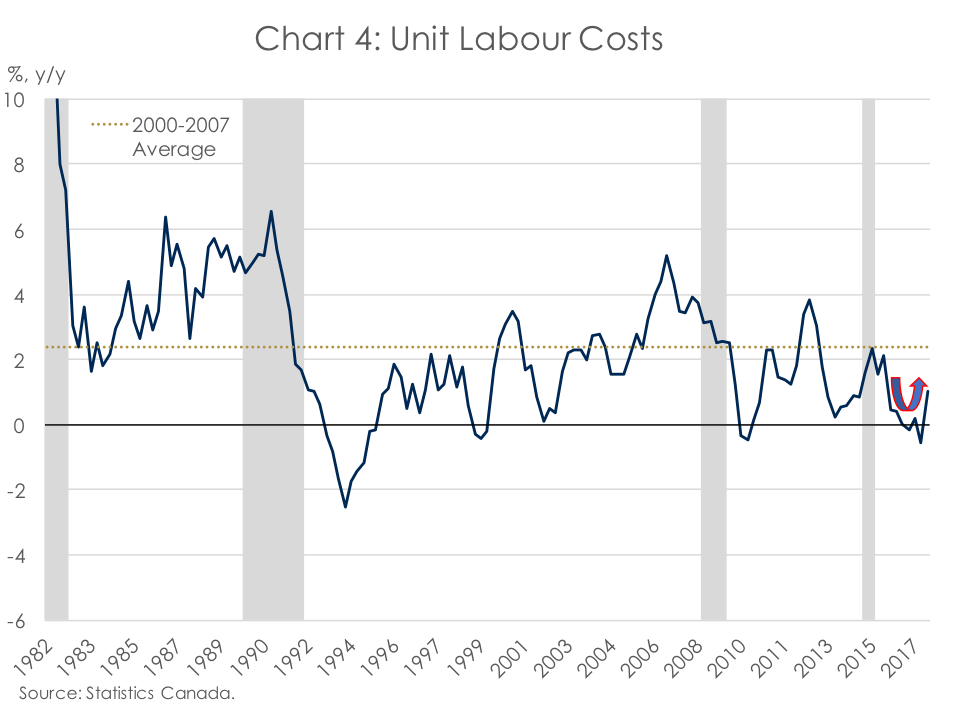
By all accounts, the BoC, like most economists, continue to consider weak wage growth as a sign of labour market slack. Several measures of wage growth in Canada exists but the one highlighted in the last MPR is unit labour cost (ULC), the average labour cost for a business to produce one unit of goods or services. ULC reached 2.1% in the last quarter of 2015 before slowing down and eventually contracting 0.6% in the second quarter of 2017. This was unlikely to generate sustained inflationary pressures in Canada. However, it rebounded to 1.0% in the third quarter of last year, giving it a yellow signal with an upward trend (Chart 4). Interestingly, this advance stand in stark contradiction to that of the typical measure of wage gains examined by economists – year-over-year growth in average hourly wages – which increased by 2.7% in December 2017.
- Involuntary Part-Time Workers
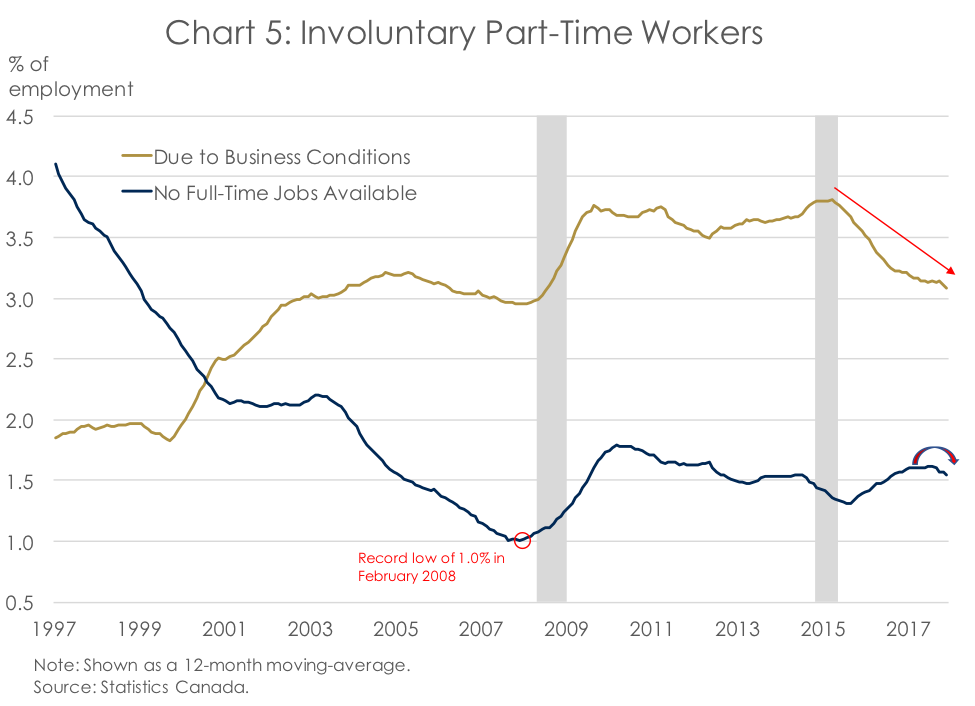
The reason why someone is working part-time might also be a source of labour market “slack”. For instance, someone in a part-time position of less than 30 hours per week may not contribute to the economy as much as she/he would like to. Therefore, those involuntary part-time workers, either due to business conditions (less hours of work available within a company) or because there are simply no full-time jobs available in the industry at the moment, are a measure of labour market “slack”. These latter folks are those that are usually referred to in BoC communications as “workers who would prefer to work full-time”.
That said, the number of these workers as a share of all workers has trended down in the last year (Chart 5). The share of workers that are working part-time because they could not find a full-time position, whether they looked for one or not, is still much higher than the record low 0.8% reached in February 2008[5].
- Youth Participation Rate
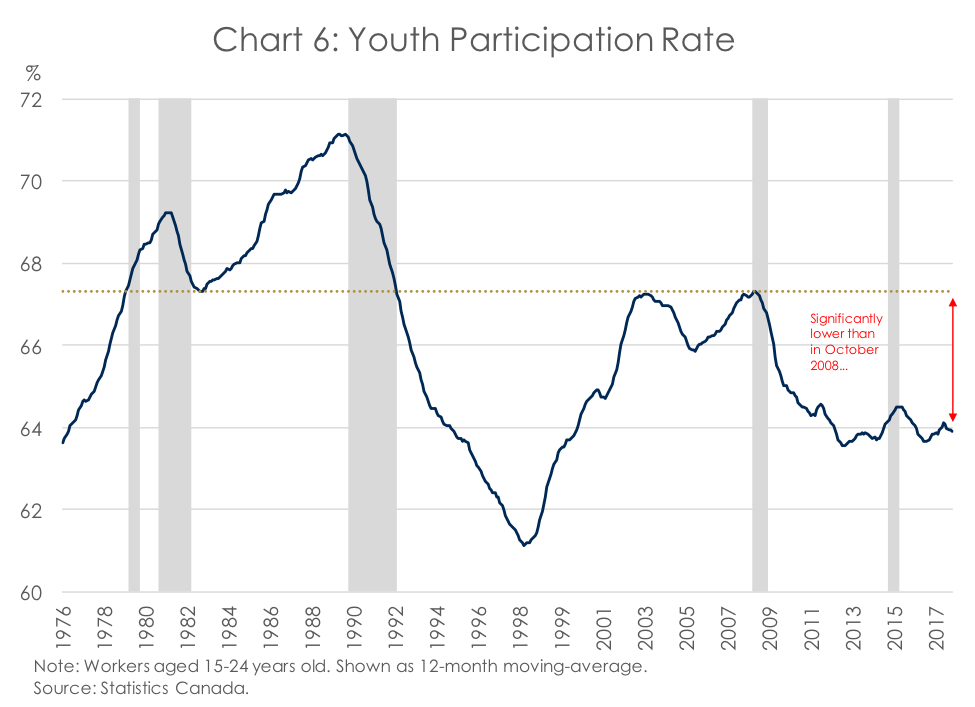
This indicator is one of the things that keep Governor Poloz awake at night: participation of young people in the labour force. It stood at 63.8% in December, slightly lower from where it was a year ago (64.2%). Moreover, and more concerning, it is still 3.6 percentage points lower than its pre-recession peak in October 2008, with no imminent signs of recovery. Now, several explanations have been brought forward to explain this statistic. First, higher educational attainment might explain some of it. As young people stay in school longer, their initial entry in the labour force is delayed. This trend is reflected in the participation rate of youth aged 15 to 19 years; now 7.0 percentage points below its pre-crisis high in September 2008. Other possible explanations include discouraged youth, skills mismatch between employers and potential employees and even, in the United States for young men, the fact that video games have become really good. And, in some of these cases, the situation might be either irreversible or will take a long-time to reverse.
- Average hours worked
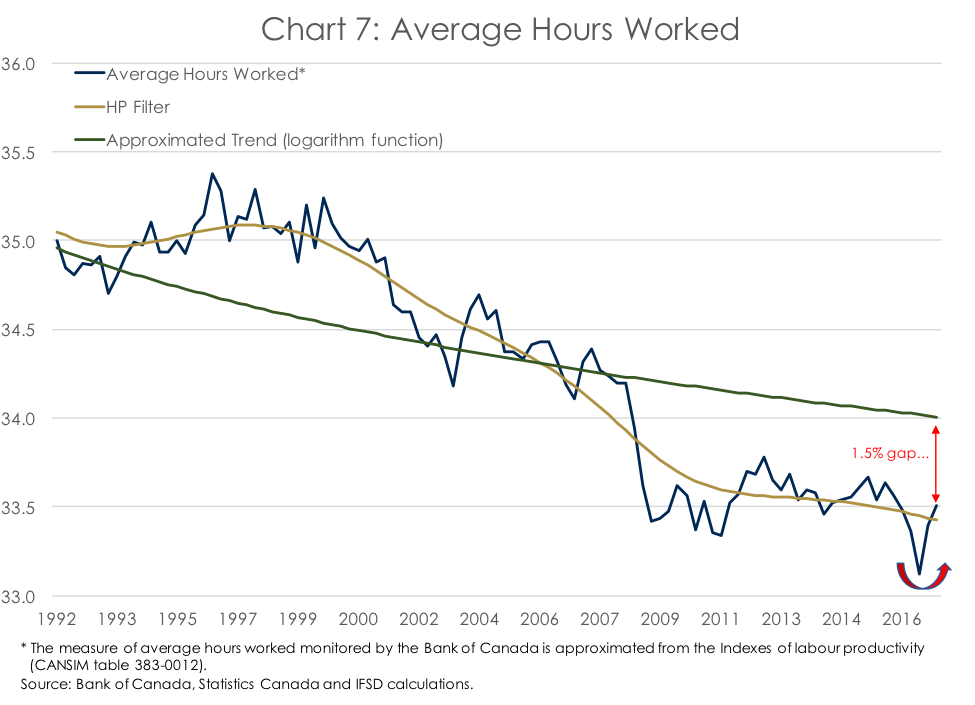
The average number of hours people usually work in a week is a useful complement to the unemployment rate, the participation rate and various measures of underemployment. Relative to a long-term trend, it can provide a measure of labour market slack as, on average, the numbers of assigned hours in a company is dependent on the demand for goods and services, which itself follows the business cycle. The Bank of Canada considers the gap between its estimated long-run trend of average hours worked, which are part of its estimate of potential output, and actual average hours worked as a measure of labour market slack to monitor.[6] Chart 7 below shows our interpretation of the BoC’s preferred measure of average hours worked. Average hours worked are still around 1.5% lower relative to its trend.[7] However, after falling to an all-time low in the first quarter of 2017, it rebounded. As a comparison, if one would use a simpler, Hodrick-Prescott (HP), version of the trend, there would be currently no average hours worked gap.
[1] “Slack” in the labour market is usually defined as the gap between the number of people who are looking for a job and the number of employers looking for an employee. The more people are looking for work, the more “slack” or excess capacity there is. More broadly, slack can also encompass people not even looking for work e.g. people who are outside of the labour force, or underemployed.
[3] By construction, the LMI is a composite measure that summarizes the information of eight underlying labour market indicators: the unemployment rate, labour underutilization (or R8) unemployment, long-term unemployment, flows into unemployment, flows out of unemployment, labour force participation rate, average hours worked and wage growth.
[4] See Zmitrowicz and Khan (2014). “Beyond the Unemployment Rate: Assessing Canadian and U.S. Labour Markets Since the Great Recession”. Bank of Canada Review. Spring 2014.
[5] On the other end, involuntary work due to business conditions have shown impressive improvement in the past year and has almost full recovered.
[7] The trend is approximated from the BoC’s latest annual reassessment of potential output growth, (Chart 12).