
by Randall Bartlett, Alex Reeves, and Ahmed Ali Hedayatullah
With the announcement of the United States-Mexico-Canada Agreement (USMCA) on September 30th, one of the few hurdles that remained in the way of the Bank of Canada taking the next step in its rate-hiking journey has been pushed aside. Now, it’s not as though the USMCA was a material game changer from the trade perspective. In fact, the USMCA looks a lot like the North American Free Trade Agreement (NAFTA) that is was intended to replace. Instead, what it did was remove a great deal of uncertainty around the economic outlook, particularly for trade and the business investment that it supports. And, with speculation abounding that the recent soft patch that business investment has been going through may now be in the rear view, the modestly more optimistic outlook for growth will undoubtedly put more upward pressure on economic growth, wages, inflation, and, ultimately, interest rates. Indeed, the U.S. Federal Reserve is currently grappling with similar circumstances and is raising interest rates in response, despite being chided by President Trump for it.
Mind the (Output) Gap
A cornerstone of the economic analysis undertaken by the Bank of Canada is the output gap––the percent difference between the level of real GDP and the trend level of output of the Canadian economy (also known as potential GDP). And while potential GDP cannot be observed, there are different approaches to approximating it, and the Bank of Canada publishes two––the Extended Multivariate Filter (EMVF) and the Integrated Approach. Without going into detail on the methodology underlying these measures, what is clear from the Bank of Canada’s estimates is that they track each other closely (Chart 1). But they are different enough to provide a more nuanced signal about the state of the economy than a single measure alone. These measures can also be compared to those of other Canadian institutions for their reasonableness––in this case, the Parliamentary Budget Officer (PBO) and Institute of Fiscal Studies and Democracy (IFSD). What can be observed is that these four measures have all moved in a similar manner, but the latter two output gap measures point to an economy that is operating above its potential.
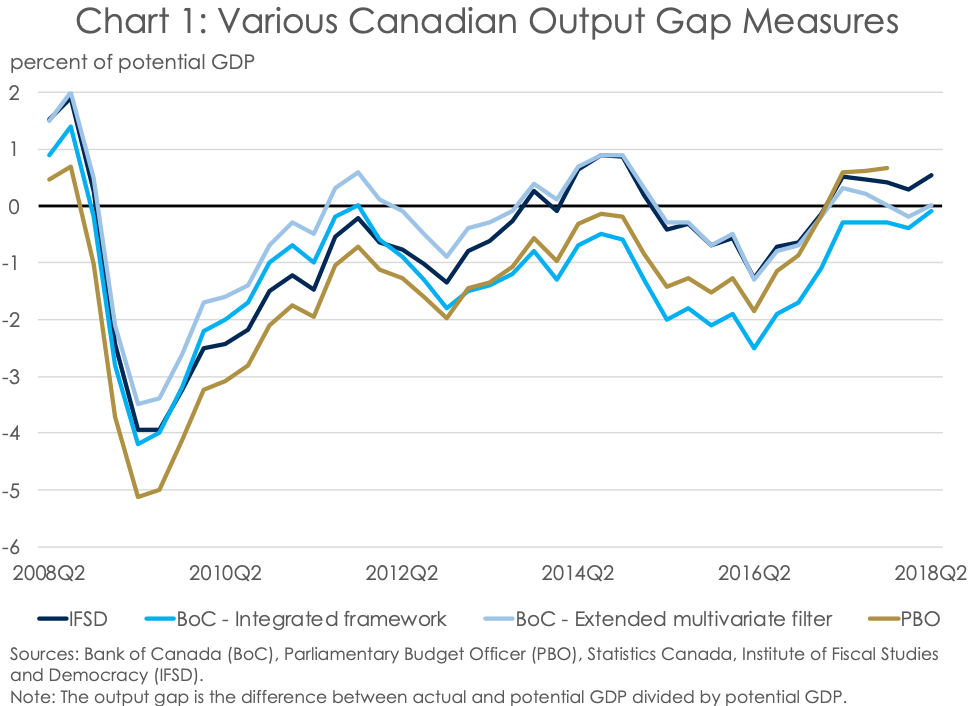
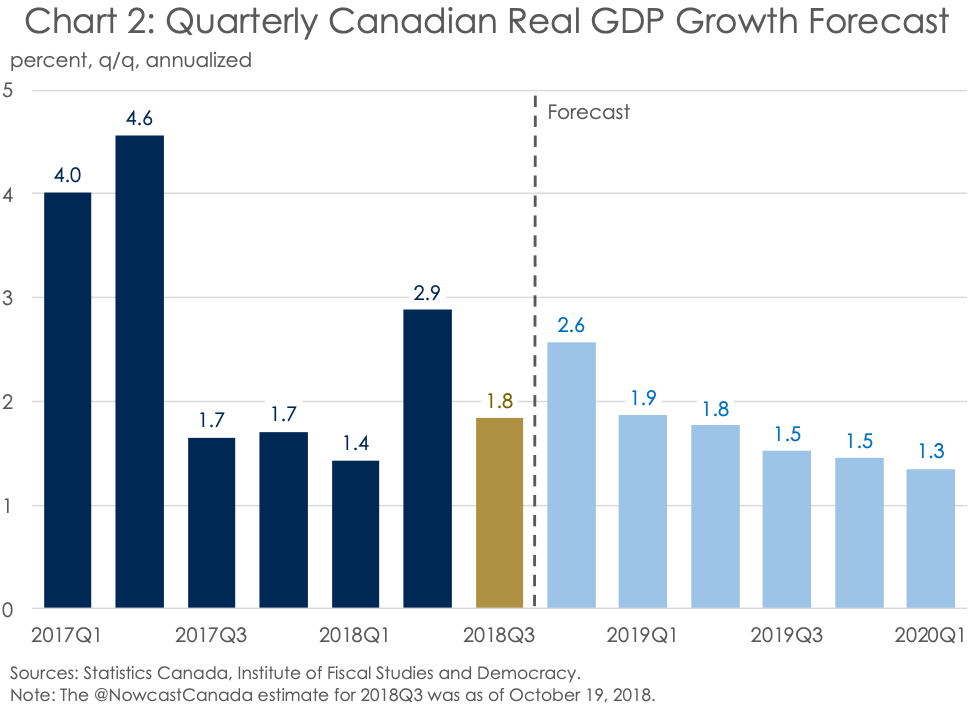
This above trend output isn’t set to change any time soon. With the IFSD’s estimate of potential GDP growth pegged at 1.9% (q/q, annualized) in 2018Q3, broadly in line with the Nowcast Canada estimate of real GDP growth in the third quarter, the output gap is set to remain in positive territory (Chart 2). This respectable estimate for Q3 real GDP growth is better than the 1.5% anticipated by the Bank in its July 2018 Monetary Policy Report (MPR), thanks to a healthy contribution from household consumption and net exports. And the solid pace of growth is expected to continue in the fourth quarter and into early 2019, on the back of robust economic activity stateside and sustained domestic demand at home.
The Canadian Labour Market Is ‘Hot, Hot, Hot’
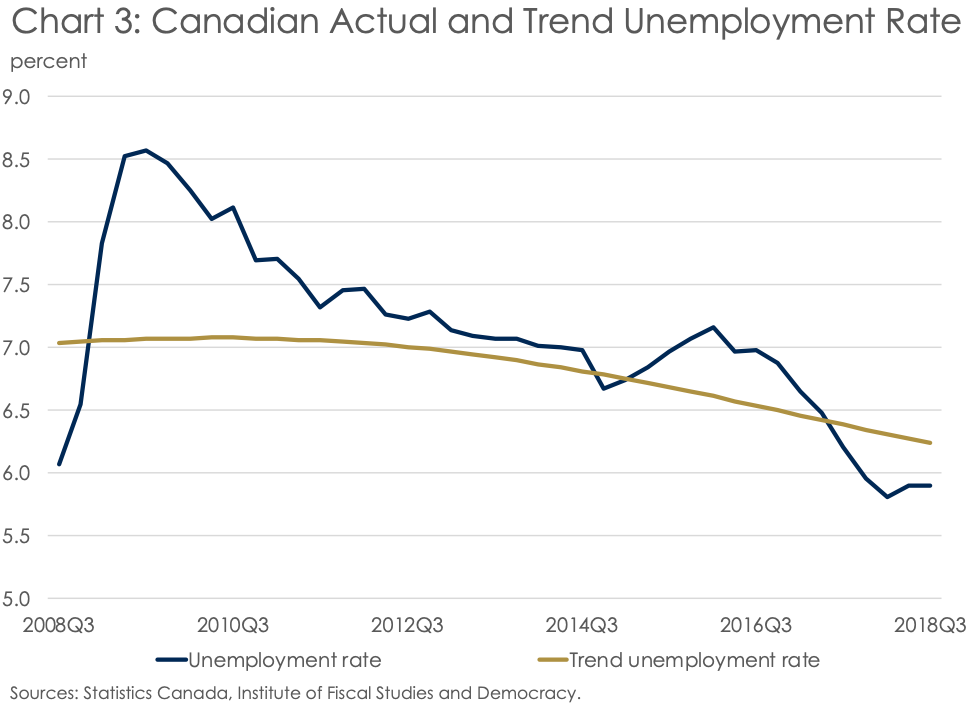
You don’t have to look far to see that the Canadian labour market is steadily tightening against the backdrop of an overheated economy. For example, at 5.9% as of September 2018, the unemployment rate is hovering around a decade low, having just come off of a four-decade low as recently as December 2017. This is well below the trend unemployment rate, suggesting that job creation in Canada has gone well beyond full employment (Chart 3).
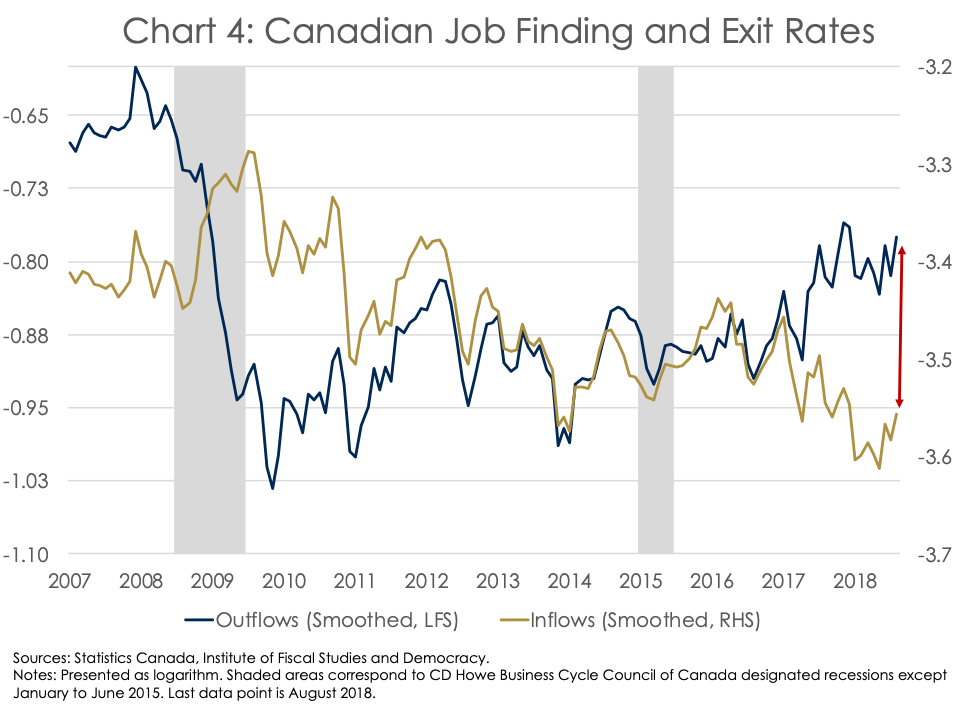
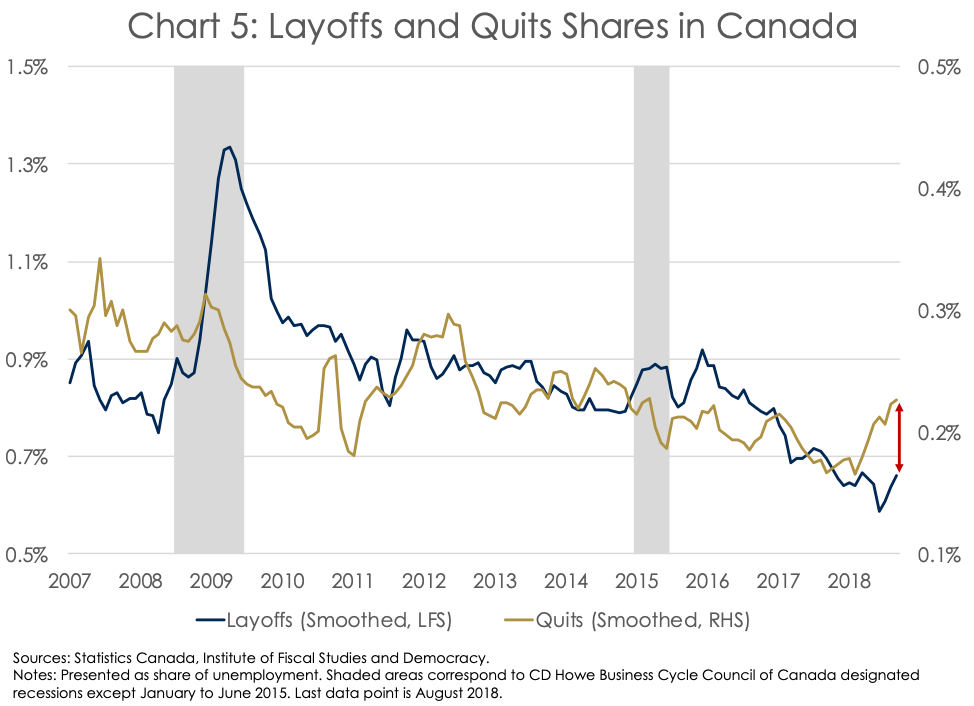
To be clear, the recent uptick in the unemployment rate in 2018 has more to do with Canadians becoming unemployed while still looking for work than with Canadians re-entering the labour force after being out in the cold. But while inflows into unemployment are on the rise, outflows continue to remain elevated (Chart 4). Indeed, relative to history, the gap between the measures remains substantial and is moving in the right direction. Also central to the discussion needs to be the cause of unemployment. Quits have been on the rise as a share of unemployment since the beginning of 2018––the first sustained advance since the Canadian economy started crawling back from the 2009 recession (Chart 5). Recently, the quits share hit its highest level since the first quarter of 2015. Meanwhile, the share of layoffs has been trending lower since reaching its lowest level in recent memory at the end of 2015. This trend highlights the increased confidence on the part of Canadians in regard to their labour market prospects.
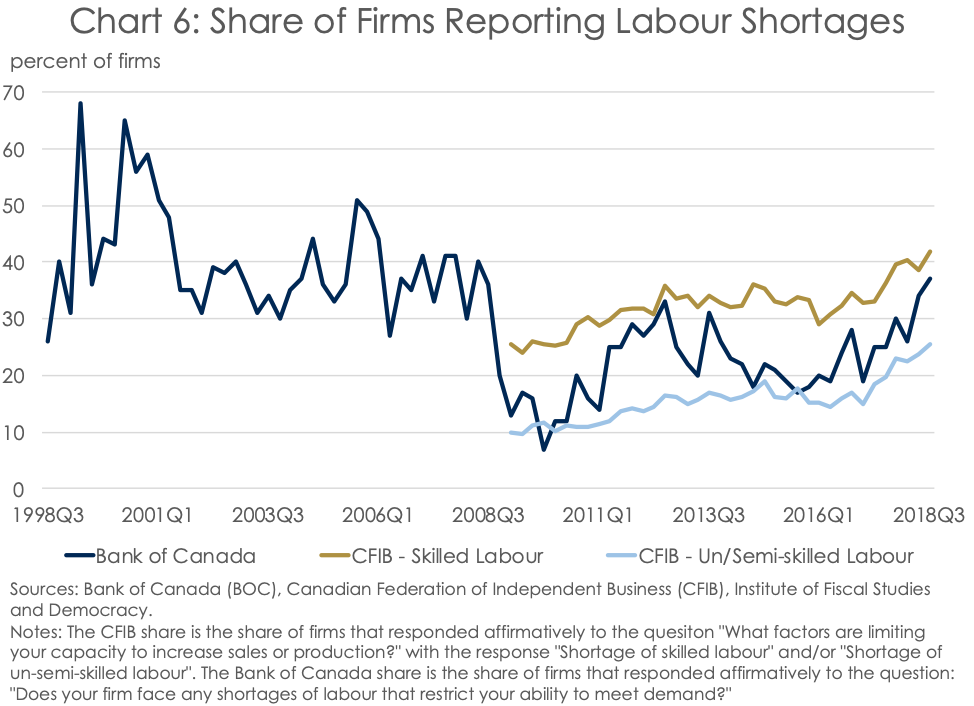
And Canadian workers have good reason to be confident. For instance, members of the Canadian Federation of Independent Business (CFIB) have reported that record high labour shortages in both skilled and un/semi-skilled labour are inhibiting their capacity to increase sales and production (Chart 6). Meanwhile, according to the Autumn 2018 Business Outlook Survey from the Bank of Canada, employers surveyed are continuing to experience acute labour shortages across the country. Indeed, at 37%, the share of firms stating that labour shortages were restricting their ability to meet demand in the third quarter of 2018 hit its highest level since 2008Q2. This also marks the first time that this share has returned to its pre-recession average (calculated from 2001Q3 to 2008Q3).
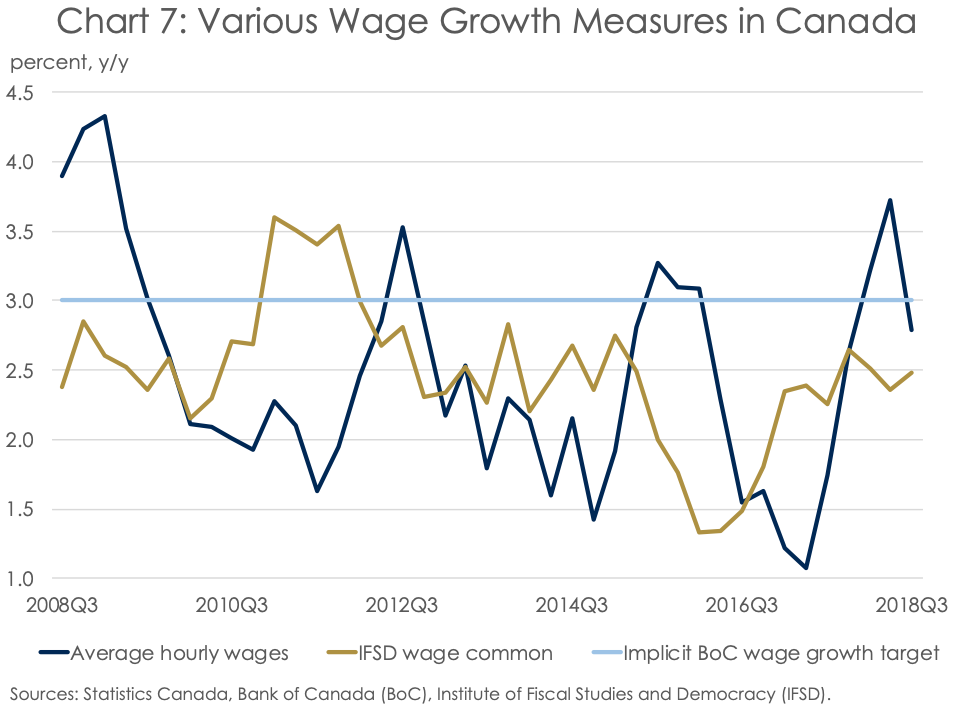
Put this all together––a tight labour market with rising labour shortages and increasingly confident job hunters––and you have a recipe for further wage gains. But the number often cited––average hourly wage growth from the monthly Labour Force Survey––can be misleading. This is because it is impacted by policy changes like the ad hoc minimum wage increase in Ontario in January 2018. Notably, this measure put the pace of wage gains at over 3% y/y in the first half of 2018 and 2.8% in Q3 (Chart 7). Contrast this with the Bank of Canada’s preferred measure of underlying wage growth––wage common. This measure, which takes into account wage data from multiple sources, puts trend wage growth at 2.3% y/y in the first quarter of the year. But as average hourly wage growth has decelerated through September 2018, the IFSD’s nowcast of the Bank of Canada's wage common measure (modelled off of the Bank’s methodology) has moved higher. Indeed, it is now pegged at 2.5% in the second half of 2018. This is approaching the Bank of Canada’s notional target for underlying wage growth of 3% y/y wage growth when the economy has returned to trend.
One Cannot Overinflate the Importance of Prices
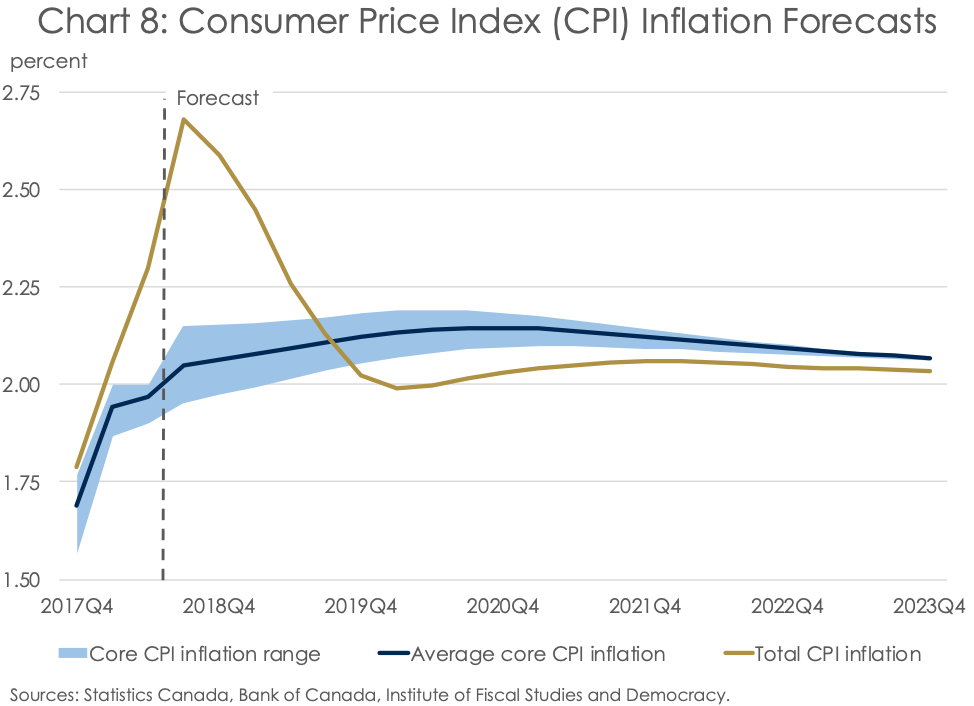
With the economy operating above its potential and wage growth accelerating on the back of a tight labour market, one would expect to see core Consumer Price Index (CPI) inflation also ticking higher. And, indeed, that is exactly what we’ve observed (Chart 8). Advancing with glacial speed and persistence, the average of the Bank of Canada’s three measures of core inflation hit 2.1% y/y in August 2018, before cooling to 2.0% in September. This is the highest level since February 2012, when the recovery from the 2009 recession was well underway. Meanwhile, total inflation––the Bank of Canada’s actual target––reached 2.8% in the same month. However, the Bank has largely looked through this price bump, chalking up much of the difference between total and core CPI inflation to the rising cost of fuel.
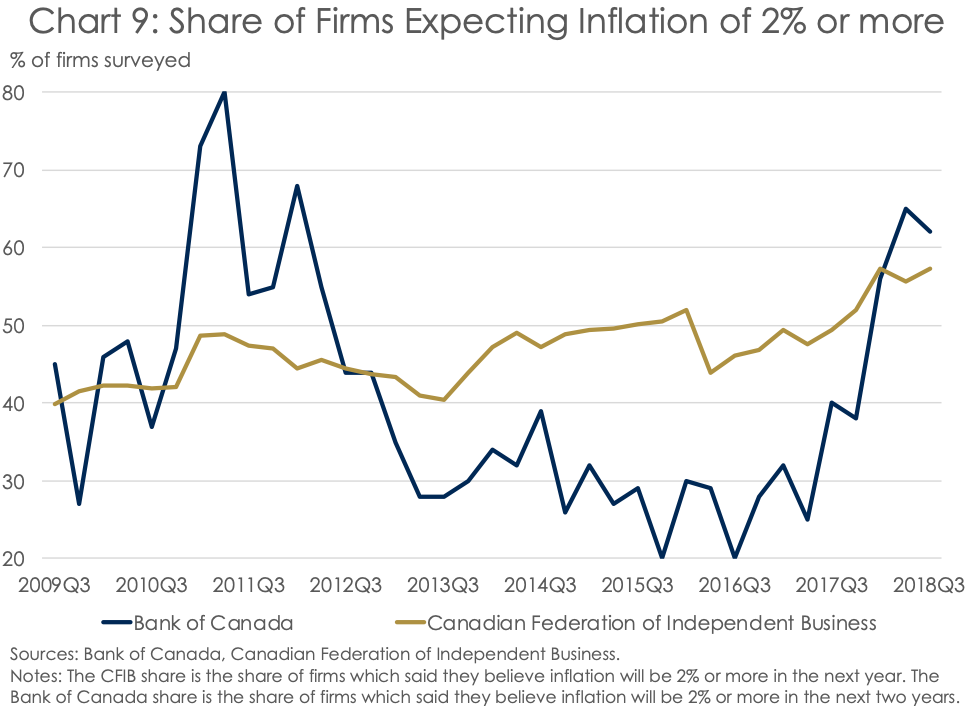
Now, if the Bank of Canada based its interest rate policy on the current level of inflation, monetary policy missteps would become more the norm rather than the exception. This is because changes in the overnight rate are estimated to not show up in the inflation numbers until about 18 to 24 months into the future. As such, the Bank must consider the expectations by consumers and businesses of future inflation when setting interest rates today. According to multiple surveys examined by the Bank of Canada, inflation expectations have moved gradually higher. For instance, according to the Autumn 2018 Business Outlook Survey, a majority of business surveyed are expecting CPI inflation over the next two years to be greater than the Bank of Canada’s target of 2% (Chart 9). A similar sentiment is shared by first surveyed by both the CFIB and the Conference Board of Canada, although the latter to a much lesser extent. The bond market is sending a similar signal, with long-term inflation expectations (the difference between the yield on nominal and real return long-term bonds) inching ever higher.
Interest Rates are Up, Up, and Away
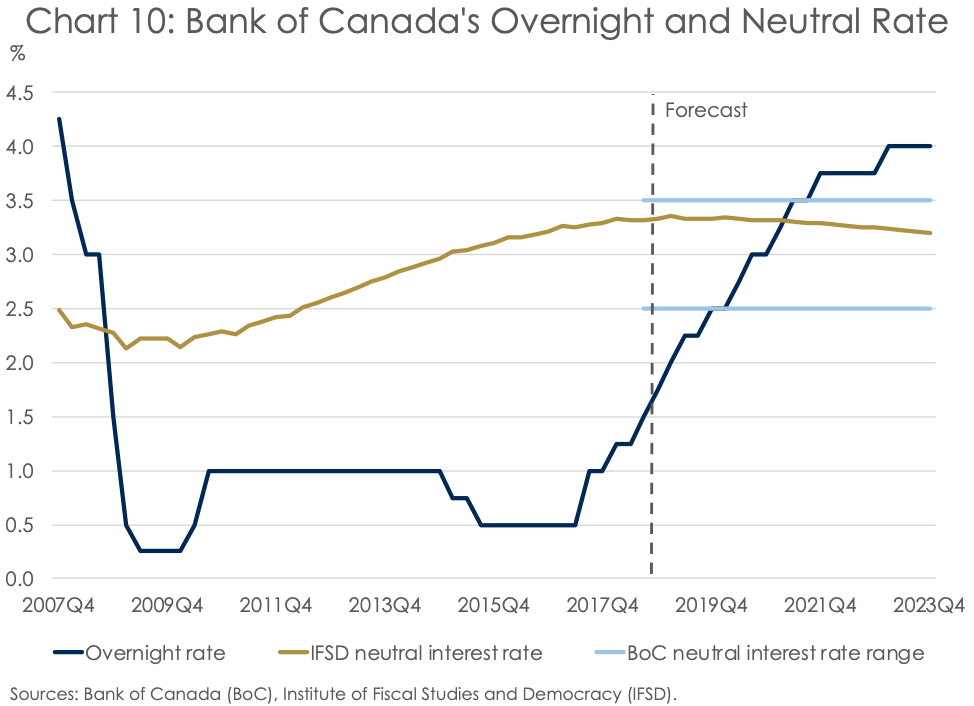
Putting this all together––an overheating economy, a hot labour market, and accelerating inflation expectations––it’s tough to find a compelling argument for the Bank of Canada not to raise interest rates again at its October 2018 fixed announcement date. And, indeed, a 25-basis point (bp) rate hike is exactly what the IFSD and most economists are calling for. But the interest rate hikes are unlikely to stop there. We anticipate three rate hikes of 25 bps each after October, which will put the overnight rate at 2.5% by the end of 2019 (Chart 10). But make no mistake. While this will leave the overnight rate at the lower bound of the Bank of Canada’s estimate of the neutral rate––the level of the overnight rate when output is at its potential and inflation is at its target––it will remain accommodative relative to the IFSD’s estimate of neutral (see methodology here). As such, at the IFSD, we anticipate that the monetary policy interest rate in Canada will move higher still, eventually topping the 3.5% upper bound of the Bank’s estimate range of the neutral rate.
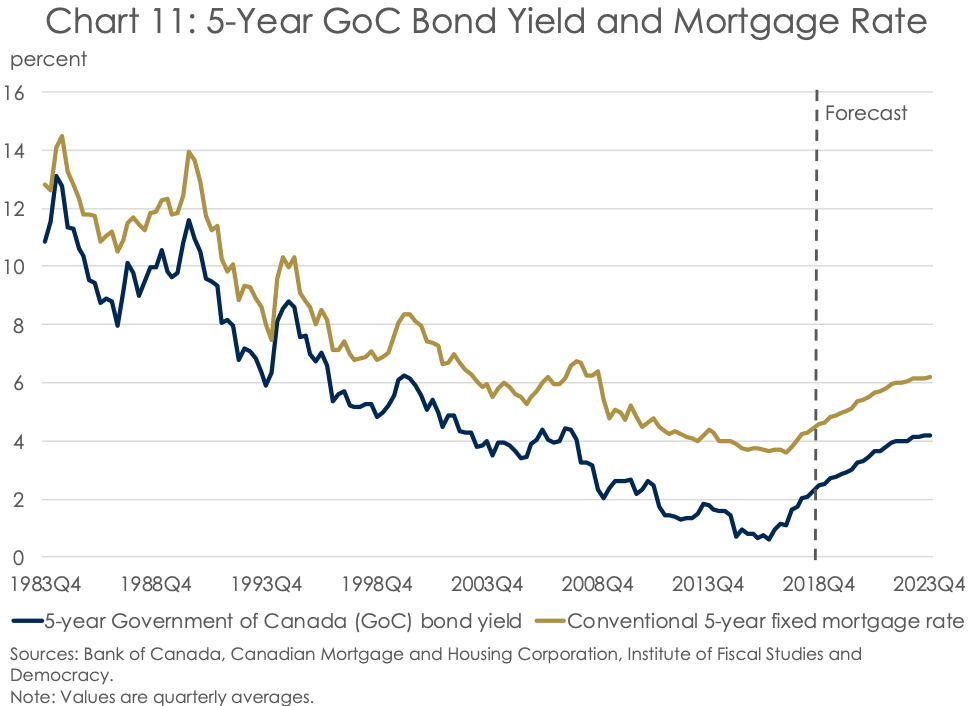
Of course, concerns have been raised about the implications of rising interest rates on highly-indebted households in Canada. But, fortunately, Canadians seem to be taking higher interest rates in stride (at least thus far), with household credit growth slowing but remaining positive and the Canadian housing market moderating toward more balanced territory. Indeed, the convention mortgage lending rate for a 5-year term has been consistently on the rise since reaching a historic low of 3.59% in May 2017. This has allowed for the unrelenting advance in household debt as a share of income to moderate along with housing-price growth, addressing some of the risks and vulnerabilities repeatedly highlighted in its Financial System Review. And this trend of rising interest rates across the yield curve is expected to continue going forward (Chart 11).
Keep in mind, these arguments reflect a more traditionalist view of how monetary policy is conducted. Instead, some have said, and will continue to say, that the world has changed so much since the financial crisis that generations of understanding of macroeconomics and monetary policy no longer apply. But these arguments seldom hold up to scrutiny. Secular stagnation––the argument that a dearth of aggregate demand has held back growth and kept interest rates low––has largely fallen by the wayside as economic activity has posted solid gains, pulling inflation and interest rates higher along with it. And secular stagnation’s call for dramatically greater government spending also raises eyebrows in the current context. Indeed, deficit-financed fiscal largesse in both Canada and the United States has come about at a time when these economies are operating at or above their trend. As a result, these fiscal measures are less likely to provide a sustained growth impulse than they are to stimulate inflation and, hence, higher interest rates.
So, the time has come for the Bank of Canada to continue its gradual and data-dependent pace of interest rate hikes. Indeed, as Christina Aguilera didn’t ever come close to saying, “capacity’s saying “yes,” and the data’s saying, "let’s go””.