by Randall Bartlett
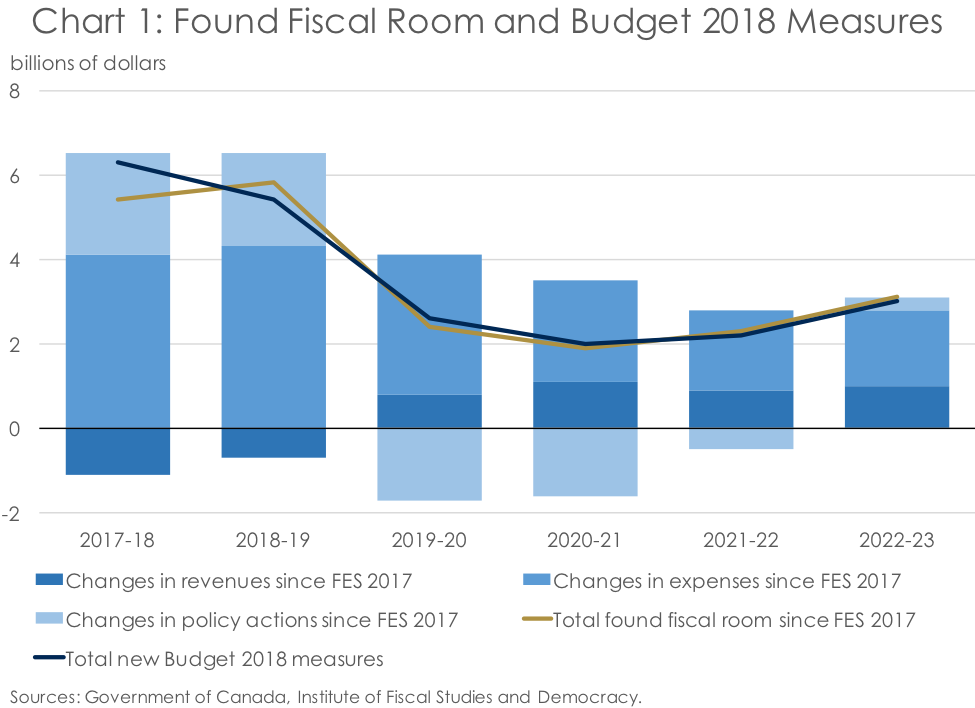
It’s been a good few weeks for the Institute of Fiscal Studies and Democracy (IFSD). Not only have we had an opportunity to ‘kick the tires’ on Budget 2018, one could argue we’ve ‘driven that lemon into the ground’ with the generous opportunities the media has given us to comment on it. But, there is still room for more commentary on this budget, as the ample fiscal room of roughly $21.5 billion over six years that magically appeared in Budget 2018 to fund new spending becomes ever more mysterious the further one digs (Chart 1).
Money for Nothing and the Cheques for Free
While easily recognized as the misheard lyrics of the 1985 hit song by Dire Straits, or for those readers familiar with the IMF working paper by the same title, the federal government also seemed to find ‘money for nothing’ in Budget 2018. What luck! And while the bulk of this came from a lower path for discretionary spending, which will be addressed later, a smaller but not insignificant portion was found in higher revenues.
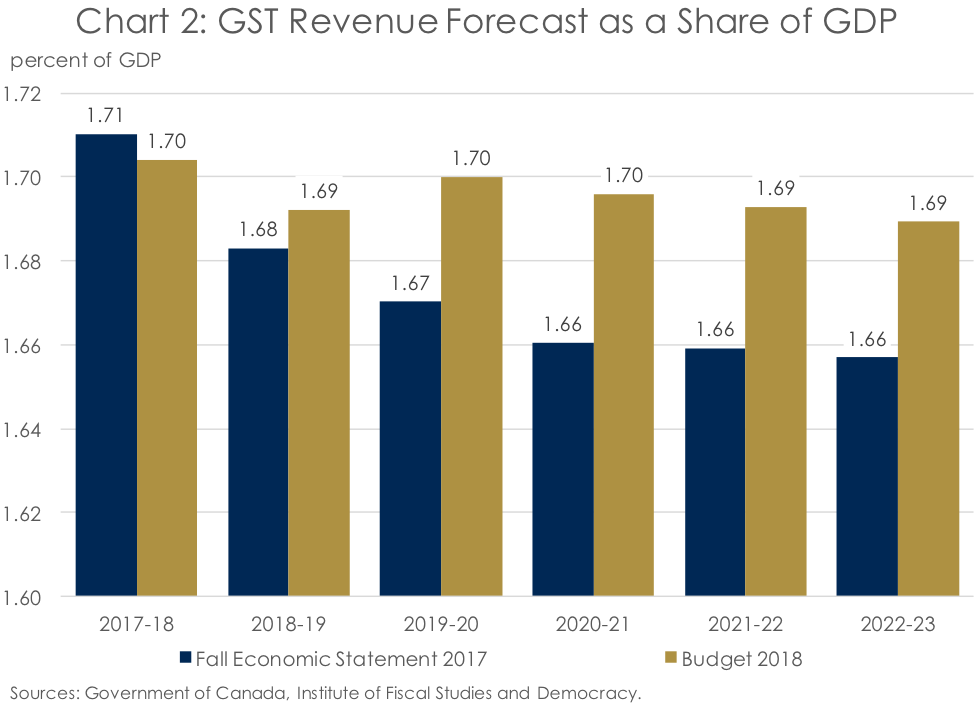
As is discussed at length in the IFSD’s March 2018 Canadian Economic Forecast and elsewhere, much of the higher revenue profile in Budget 2018 comes from an unexpected upward surprise in the Goods and Services Tax (GST) take relative to the Fall Economic Statement 2017 (FES 2017). Indeed, this constituted a significant share of the newfound-revenue room the federal government discovered before any policy changes were made (Chart 2). Revenues from custom import duties (CID) were also revised higher, in roughly the same order of magnitude as the increase in the GST take (Chart 3). This suggests the federal government’s forecast for imports was also revised higher, although we may never know as it is not published. Meanwhile, the pre-measures personal income tax (PIT) revenue remained broadly unchanged, suggesting that higher consumption and imports are not linked to more elevated personal incomes. And with the outlook for interest rates being essentially the same in Budget 2018 and the FES 2017, one can only assume that higher consumption will be financed by rising household debt as affordability gets squeezed.
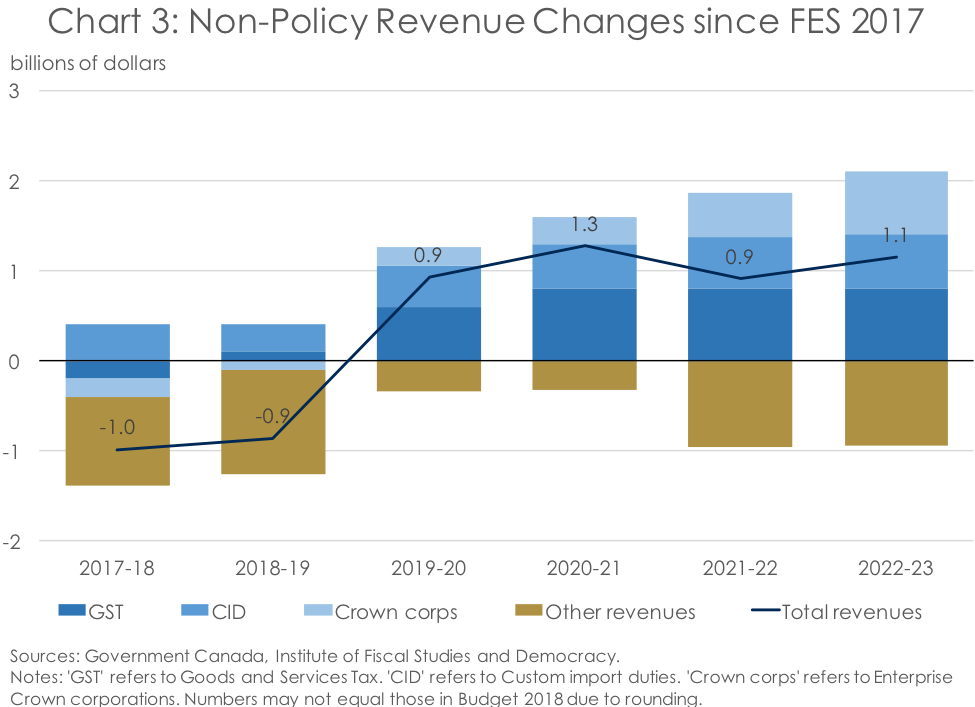
However, with the level of nominal GDP being about $4 billion lower, on average, over the forecast, other income and expenditure categories must have also been revised in order to ensure the math works to offset higher consumption and imports. And, indeed, some of this ground is made up on the income side of GDP by a lower outlook for pre-Budget 2018 corporate income taxes (CIT). Whether this lower corporate tax base is the function of more subdued profits than previously expected or higher relative expenses due to more elevated business investment with a high import content, again we will never know. Tack on to that the more elevated outlook for non-resident income tax revenues and profits from enterprise crown corporations (averaging $0.3 billion and $0.2 billion, respectively, on an annual basis over the forecast), and it’s hard to ‘square the circle’ on this economic and revenue forecast.
Beyond just the underlying changes to the economic and fiscal outlook, there were important new revenue measures introduced in Budget 2018 that are worth a closer look. The first is the change in tax rules on holding passive investments inside a private corporation. The federal government expects to pull in around $0.6 billion annually and growing from this tax change. This is in addition to the tax changes to income sprinkling announced in December 2017, on which the federal government expects to generate around $0.2 billion annually. Meanwhile, the Parliamentary Budget Officer recently published analysis on income sprinkling using private corporations as well. It suggested the federal government could net nearly twice that much by the end of the 5-year fiscal forecast from the income-sprinkling tax changes ($0.4 billion), pointing to the possibility of an upside surprise to revenues. This is good news for the federal government, as its higher revenue estimate of over $0.4 billion annually from ‘Closing Tax Loopholes’ may prove more precarious, if history is any guide.
The federal government also managed to find additional revenues in good ol’ fashioned ‘sin taxes’, with increased excise taxes on tobacco expected to pull in an average of nearly $0.3 billion annually over the next five fiscal years. Tax revenue from the sale of legal cannabis is also forecasted to help bolster federal coffers, pulling in about half the average annual tax take as the additional amount from higher tobacco taxes. This should help to offset the lower revenues from CID as a result of the federal government signing on to the Comprehensive and Progressive Trans-Pacific Partnership (CPTPP) (formerly known as the Trans-Pacific Partnership, but now more comprehensive and progressive). This equates to an annual estimated loss in CID revenues of about $0.5 billion over the forecast starting in the 2019-20 fiscal year.
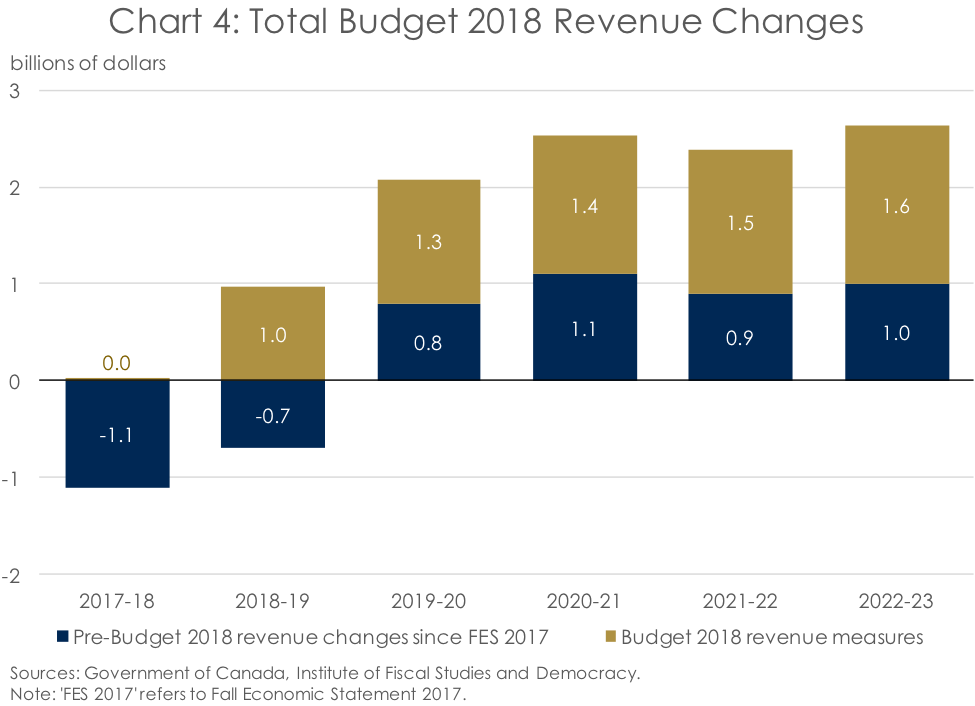
In total, new revenue measures in Budget 2018 added an additional $6.8 billion to the $2.0 billion in total fiscal room over the forecast that appeared thanks to a revised economic outlook (Chart 4). This new found fiscal wealth provided $8.8 billion in wiggle room from the 2017-18 through 2022-23 fiscal years the federal government didn’t have before. And they wasted no time in spending it.
Fiscal Taps’ On, Taps’ Off … and Then Taps’ On Again
While higher revenues certainly helped to boost the fiscal prospects of the federal government in the coming years, the real story is in spending. And not the ‘Major transfers to persons’ or ‘Major transfers to other levels of government’ that are largely tied to pre-existing legislation, but the discretionary spending contained in Direct Program Expenses (DPE).
But before diving into the critique of the DPE forecast, it is first important to recognize that Budget 2018 contained more information on federal spending than past documents. Most new measures in the budget were costed and presented in tables which provided a 5-year forecast for the new spending by department.
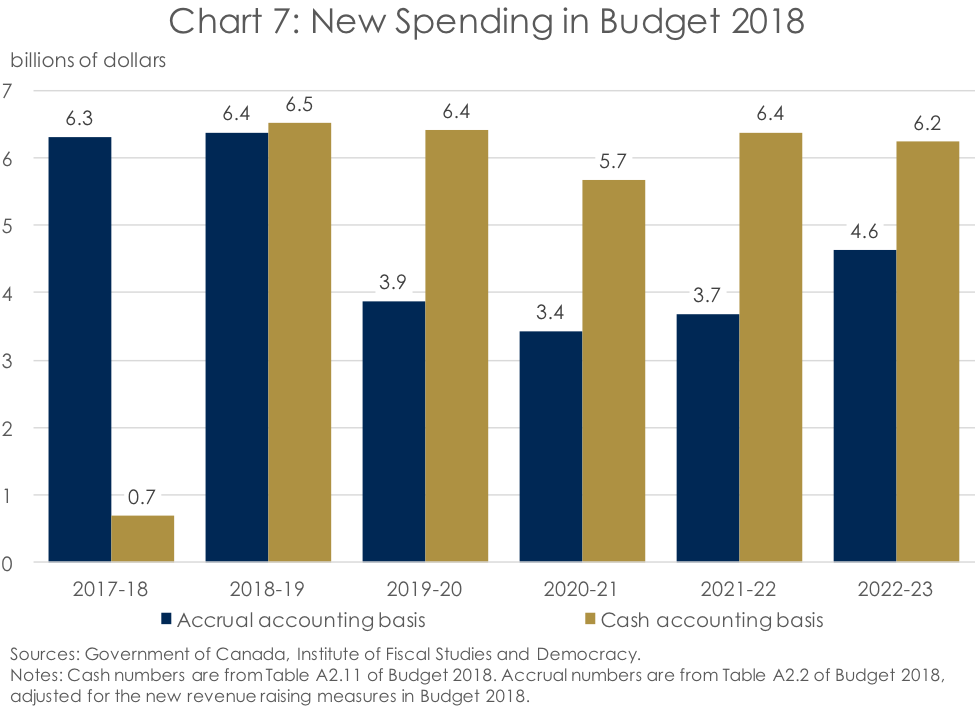
While a step in the right direction, these new measures also left much to be desired. First, they were presented by department on a cash basis whereas the total DPE line in the budget is presented on an accrual basis, thereby making it a challenge to exactly reconcile the two. Second, there are no departmental reference levels presented for spending, so one can’t be sure as to exactly what the federal government is spending and where beyond the new measures themselves. Third, operating expenses and capital amortization were merged into one amorphous discretionary-spending blob for the first time since the current government has been in office, further muddying the understanding of what is happening at the departmental level. (Until Budget 2018, DPE were broken down into three broad categories: operating expenses, transfer payments, and capital amortization).
This begs the question: Is the Budget 2018 forecast for DPE credible? Again, as the IFSD observed in its January 2018 federal fiscal forecast, the answer is no, largely reflecting the fact that it is not transparent. And “[w]ithout transparency, there can be no accountability.”
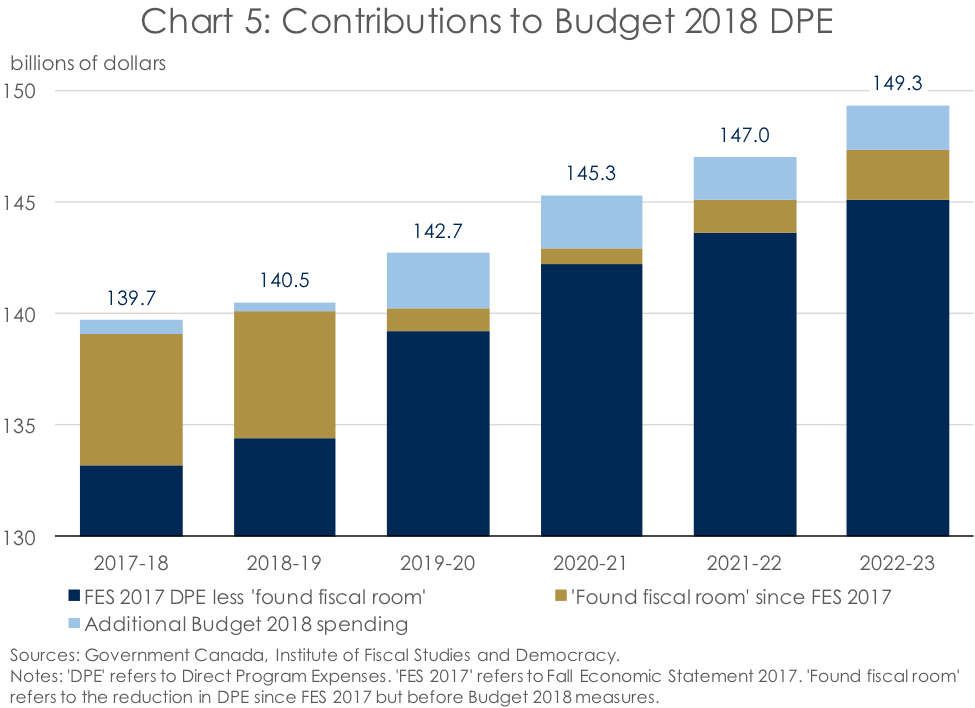
Starting with the change in the federal government’s DPE forecast that was the source of $15.9 billion in savings since the FES 2017 but prior to the new measures in Budget 2018, we first need to rule out what was not included in this amount. This number does not include the significant lapse in infrastructure investment that the federal government was not able to get other levels of government to sign on to (since these are included in ‘Policy actions since FES 2017’). It also doesn’t include any other policy actions since FES 2017, including the measures in Budget 2018. According to the feds, it instead exclusively reflects lower projected expenses for consolidated Crown corporations, year-to-date results, and updated departmental outlooks.
Basically, the federal government asking us to believe that the downward revision to DPE is equivalent to a forecasting error to the tune of a cumulative $15.9 billion from fiscal 2017-18 through the 2022-23 fiscal year (Chart 5). But, at the IFSD, it is not the size of the forecasting error that matters. This revision is instead particularly questionable due to the fact that there is almost no information provided as to where that forecast error is to be found. Is it the Department of National Defence? Employment and Social Development Canada? Maybe Public Services and Procurement Canada? As was the case with some of the upward revisions to revenues, we may never know. This is particularly the case as the federal government is insisting that this information must remain confidential. Indeed, they went so far as to only give this information to the Parliamentary Budget Officer (PBO) on condition that it not be published. As a result, parliamentarians and Canadians cannot know what the changes are, and are therefore unable to hold the government to account.
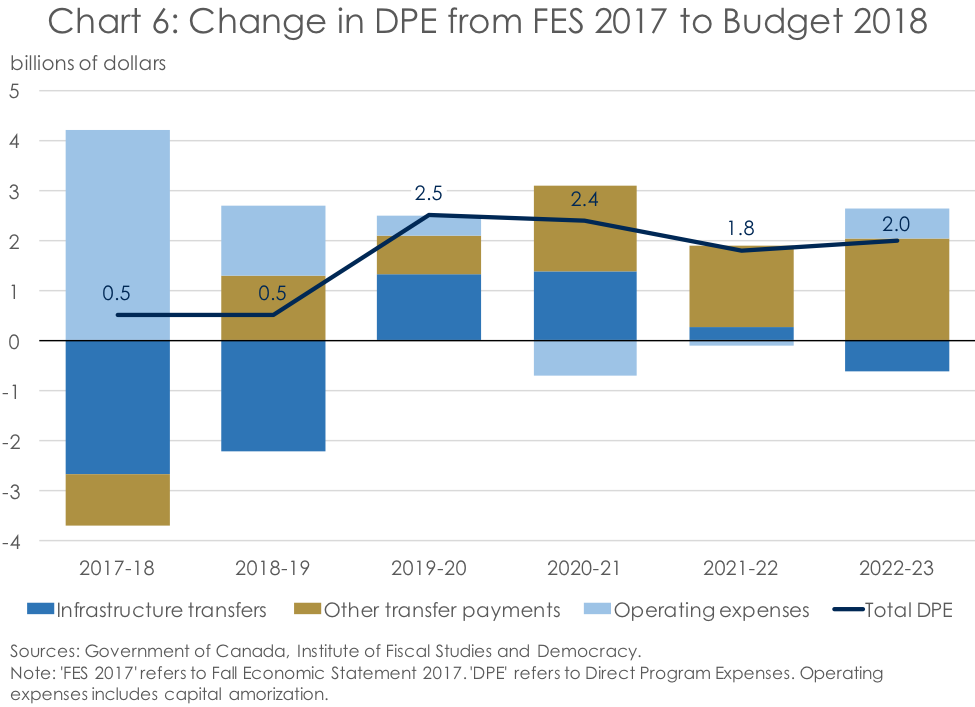
Looking to the components underlying DPE, one can see that the net change in DPE from FES 2017 to Budget 2018 was a function of both changes in transfer payments and operating expenses (Chart 6). Of the total $9.7 billion increase in DPE from the 2017-18 through 2022-23 fiscal years, nearly half was a net increase to transfer payments ($3.9 billion) while the remainder was an increase to operating expenses. And while tables in Budget 2018 very generously lay out a costing for each new measure through the 2022-23 fiscal year, with no department spending reference levels provided in either the FES 2017 or Budget 2018, one can’t know for certain how this is impacting individual departments. Further, as detailed forecasts for new departmental spending are provided on a cash basis, the ‘Total investment in Budget 2018’ differs from table to table (Chart 7).
All this to say, for the IFSD to find the DPE forecast credible in the upcoming FES 2018, regardless of that focus-group-tested measures it may contain, the federal government must present the following information:
- The spending by individual department on an accrual basis that underlies the Budget 2018 DPE forecast, which must add up to the total operating expenses line presented in Budget 2018.
- The total economic and fiscal developments since Budget 2018, on an accrual basis by department where relevant.
- Individual policy actions by department since Budget 2018 on an accrual basis.
- New fiscal measures by department on accrual basis, followed by the final projected spending line by federal department.
After that, anyone with the ability to add and subtract should be able to better follow where the federal dollars are going. And if the federal government also wants to throw in forecasts of planned expenditures on a cash basis for good measure, that’s welcome too. Of course, there is the possibility that we could get some of this additional information with the tabling of the Main Estimates in April, as the government has committed to providing an in-year cash-accrual reconciliation. There is also an opportunity to provide medium-term outlooks by department that are consistent with operating expenses forecasted in Budget 2018 when the Reports on Plans and Priorities are table this spring.
The reason for this ask isn’t to be difficult. It’s in the hope that the federal budget will become more accessible for both parliamentarians and citizens. This will be imperative as big-ticket commitments, such as the new defence strategy and National Housing Strategy, start getting baked into the fiscal framework. And besides. When we can all track the money, it’s easier for us all to hold the government to account and, hence, better for our democracy.
IFSD-Budget 2018 fiscal mashup
Of course, no commentary by the IFSD on Budget 2018 would be complete without an update to our in-house federal fiscal forecast. Without having much time to review the individual new budget measures in significant detail, we will incorporate the cost of them into our forecast as given. Revisions to the outlook will also reflect changes to the economic forecast and some minor modelling tweaks on the margins.
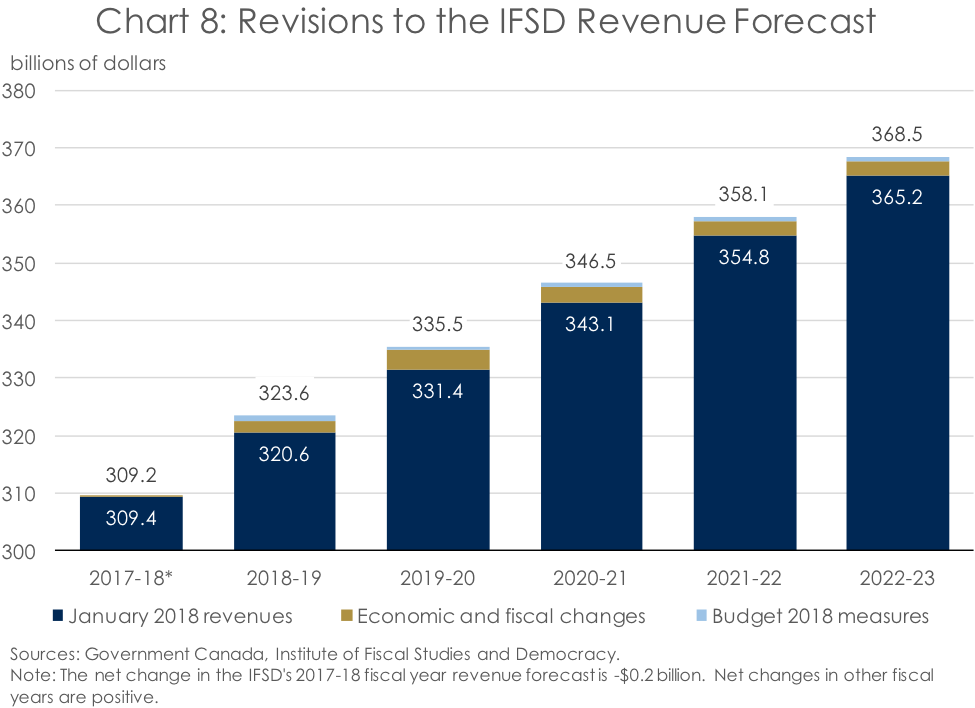
Starting with revenues, Chart 8 presents the aggregate revenues published in the IFSD’s January 2018 federal fiscal forecast. In the spirit of Budget 2018, we present the changes to the revenue forecast as a result of our changed economic forecast and pre-Budget 2018 fiscal information. We then add in the Budget 2018 revenue measures discussed earlier, such as changes to the taxation of passive income, the introduction of the CPTPP, levies on the sale of legal marijuana, etc. This gets us to the bottom line for total revenues which forms the starting point for our budgetary balance forecast.
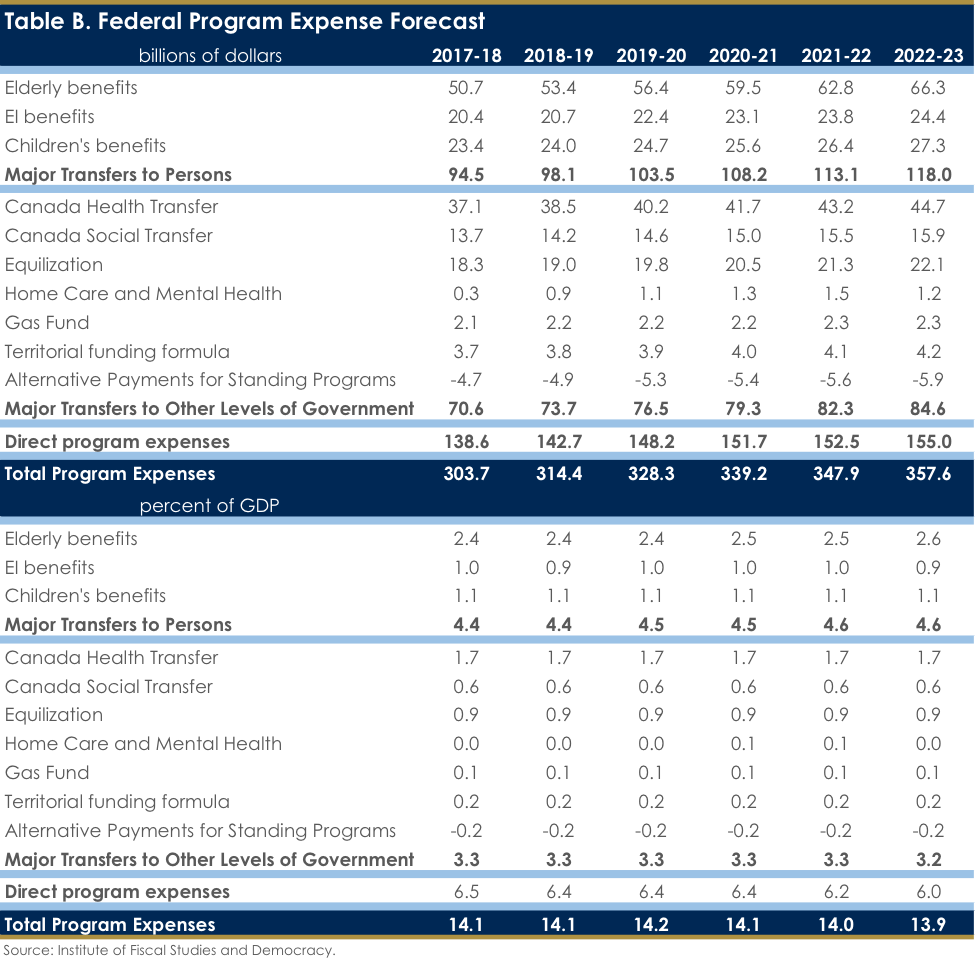
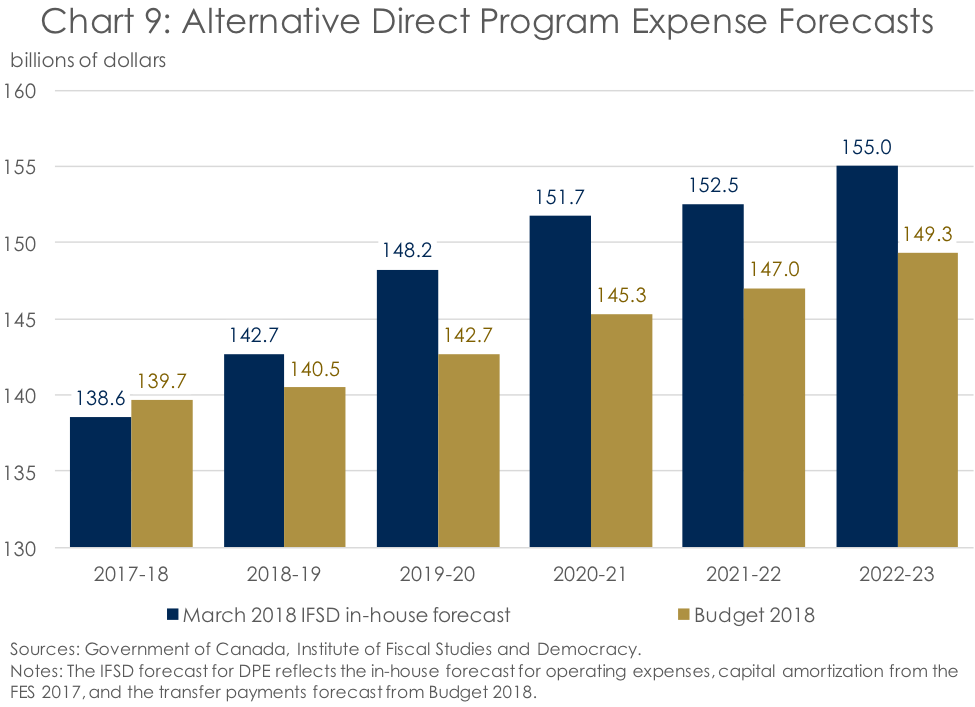
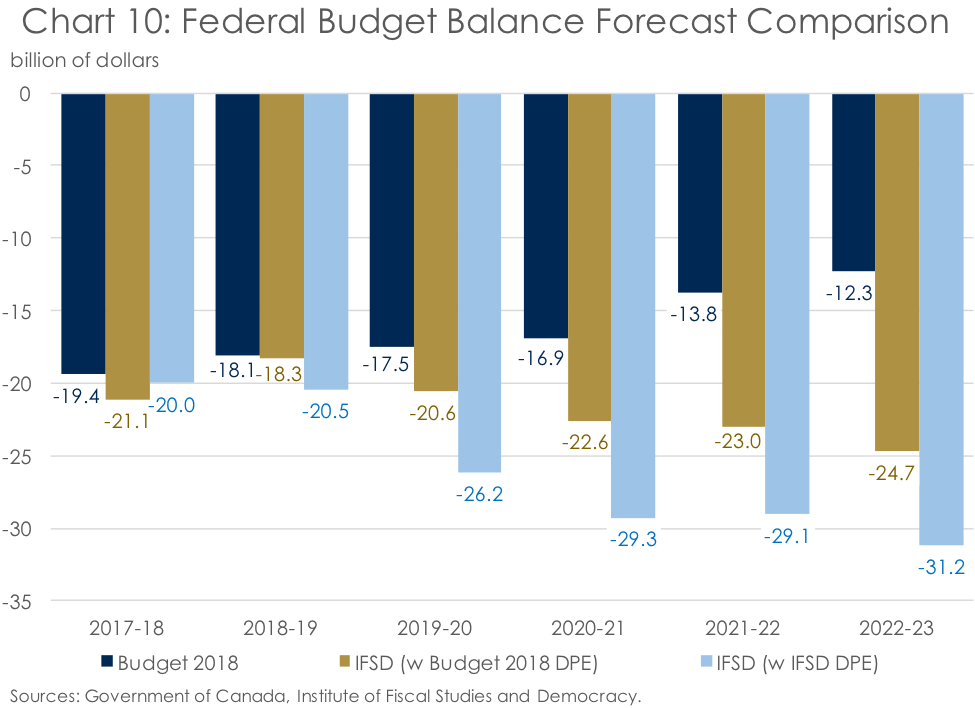
Next, we have spending, which is where things get a little more complicated. Thankfully, spending categories like ‘Major transfers to persons’ and ‘Major transfers to other levels of government’ are relatively straight forward, as they are by-in-large forecasted with economic variables such as CPI inflation, growth in the relevant population, etc. In contrast, DPE is almost entirely discretionary. And as was discussed previously, its forecast was revised lower across-the-board before including new measures, and this is what created most of the fiscal room in Budget 2018. The reasons for this, we are told, are lower projected expenses for Crown corporations, year-to-date results, and updated departmental outlooks. At a total downward revision of $15.9 billion, or an average of $2.7 billion annually, this revision is substantial. However, insufficient details are provided so as verify the credibility of the forecast. As such, the IFSD will publish two different DPE forecasts – the forecast from Budget 2018 and an update to the IFSD’s bottom-up DPE forecast published just before the budget (Chart 9).
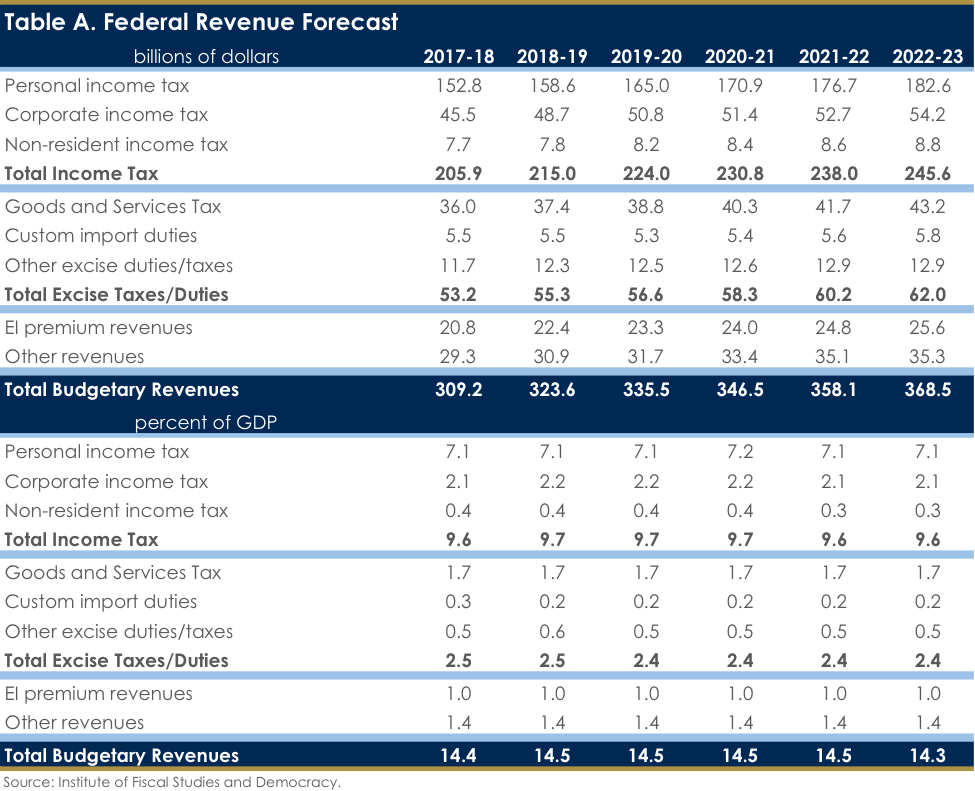
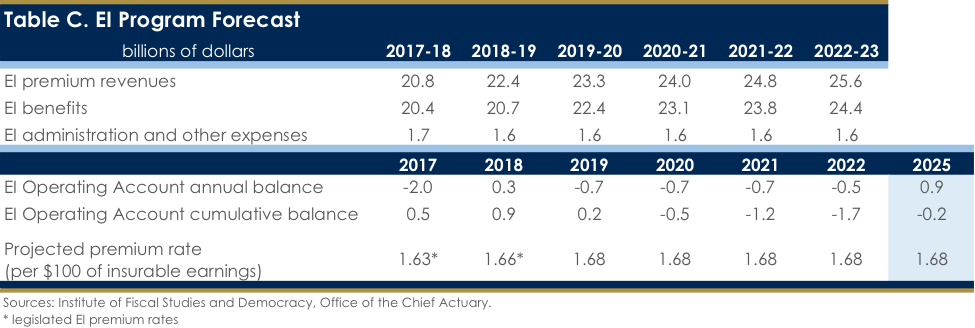
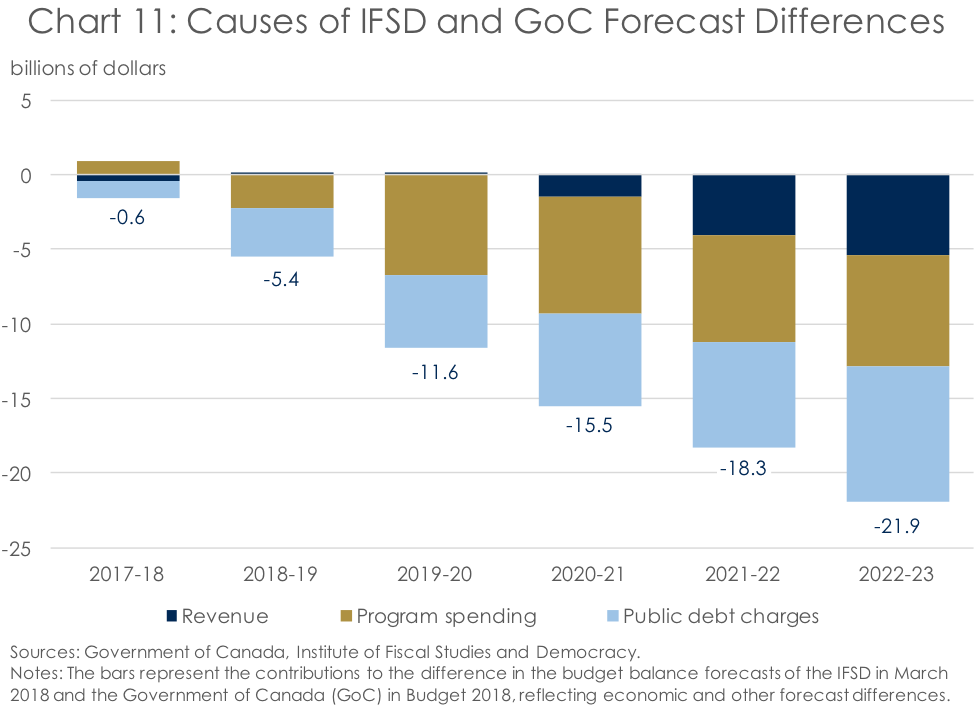
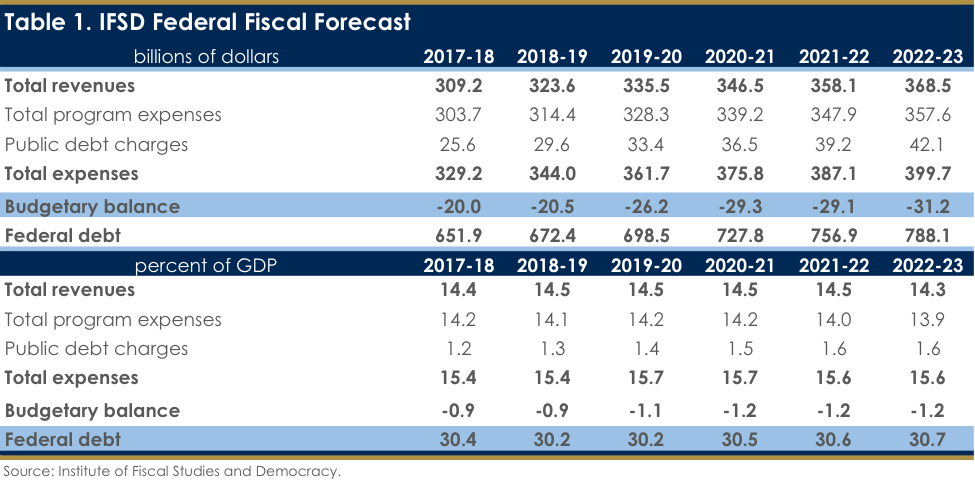
Using these two separate DPE forecasts leads to markedly different budget balance results (Chart 10). However, they do have one thing in common – while the deficit is expected to shrink in the 2018-19 fiscal year relative to fiscal 2017-18, deficits are expected to increase thereafter regardless of the DPE forecast used. This reflects the fact that the IFSD has a more modest revenue forecast than the federal government, as well as a higher forecast for public debt charges reflecting the compounding effect of larger deficits and higher interest rates. (Chart 11). Taking this all together, the IFSD’s base case outlook is for ever rising deficits (Table 1; see Tables A through C for more details on the IFSD’s federal fiscal forecast).
Conclusion
To sum up, while Budget 2018 revealed more information around spending that past budgets, it left more questions than answers. And with the federal government refusing to reveal which departments and program activities saw downward revisions to their spending forecasts, the real story of Budget 2018 is: Why the secrecy around changes to departmental references levels? Having given the numbers to the PBO on condition that they remain confidential doesn’t speak well of either the PBO or the federal government, as the lack of transparency doesn’t allow parliamentarians to hold the government to account or independent experts to verify the budget’s credibility.
But regardless, independent of the spending outlook, it is the view of the IFSD that deficits will broadly increase over the forecast, as a result of lower revenues, more elevated DPE, and higher public debt charges than assumed in Budget 2018. On the revenue side, the increase in the tax take relative to the FES 2017 at the same time that the outlook for the level of nominal GDP has been lowered stretches the bounds of belief. Meanwhile, longer-term interest rates in Canada are expected to trend higher over the forecast. And with the Bank of Canada in the early days of a hiking cycle, albeit a very gradual one, short-term interest rates are moving higher as well. As such, the risks to the federal government’s fiscal outlook are almost entirely tilted to the downside, meaning the feds could be in for a bumpy fiscal ride heading into the 2019 election.
