by Randall Bartlett
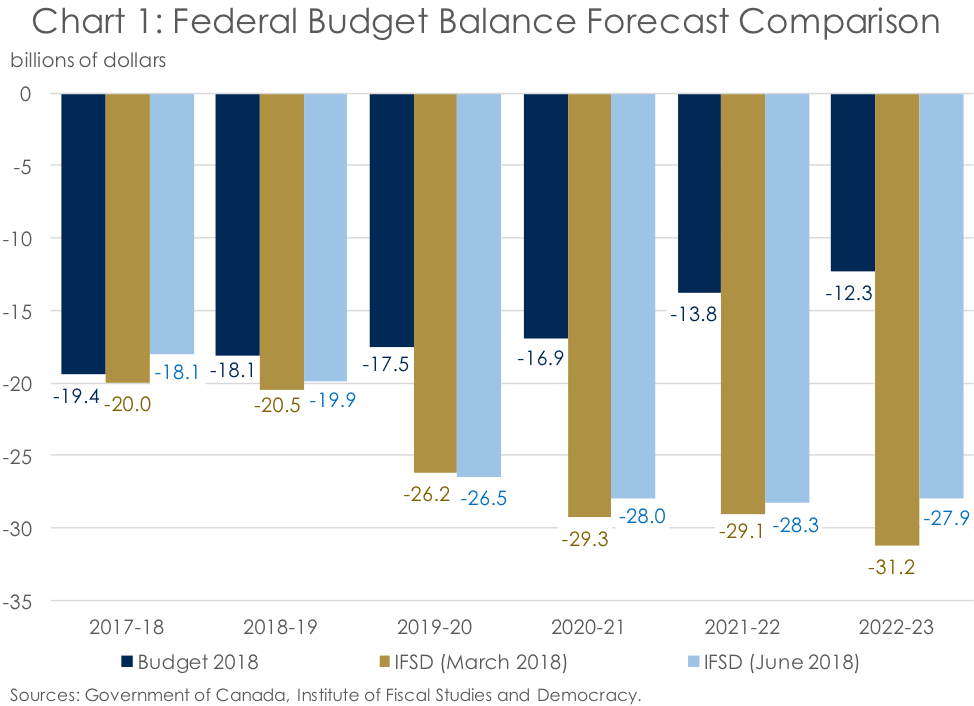
In its March 2018 Fiscal Monitor, the federal government stated that is deficit estimate for the 2017-18 fiscal year was “… broadly in line with a $19.4-billion deficit projected in Budget 2018 for 2017–18.” For any government, a deficit outlook in line with the recent planning expectations is always good news, being second only to an upside surprise. And, indeed, at the Institute for Fiscal Studies and Democracy (IFSD) we think there is room for the deficit in the 2017-18 fiscal year to come in slightly smaller than was anticipated in Budget 2018 and the Fiscal Monitor.
But that is where the good news ends. Despite some improvement in the deficit outlook for the 2017-18 and 2018-19 fiscal years relative to the IFSD’s March 2018 federal fiscal forecast, our projection is for rising deficits over much of the outlook (Chart 1). And while deficits are forecasted to come in slightly lower over much of the forecast than was anticipated in March 2018, they are a world away from the highly optimistic forecasts published by the Government of Canada in Budget 2018.
What the March 2018 Fiscal Monitor can tell us about the in-year deficit
Changes in the IFSD’s federal fiscal forecast from March to June 2018 broadly reflect two factors: changes to the economic forecast and changes to the 2017-18 fiscal-year information. The new IFSD Canadian Economic Forecast, ‘Despite Trade Uncertainty, the Outlook Remains Positive’, has shown some slight improvement in the near-term outlook relative to the IFSD’s March 2018 Canadian Economic Forecast. But, in the long run, not much has changed on the economic front. Instead, many of the changes to the IFSD’s federal fiscal forecast reflect changes to the starting point, that is to say the 2017-18 fiscal year.
On the surface, as cited in the March 2018 Fiscal Monitor, the in-year deficit estimate has come in relatively close to that projected in Budget 2018. That’s no coincidence. Over the last couple of decades, the March vintage of the Fiscal Monitor has provided an excellent estimate of the deficit number signed off on by the Auditor General of Canada and ultimately published in the Public Accounts of Canada (Chart 2). More specifically, the March vintage of the Fiscal Monitor provides a full fiscal year of information on the federal government’s finances on an accrual basis.
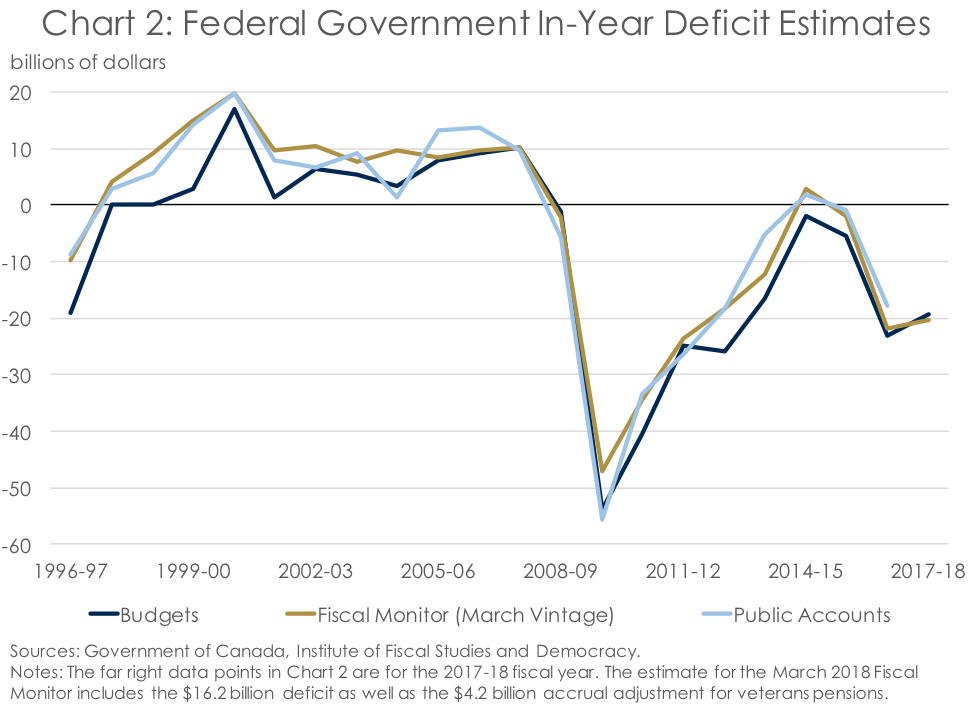
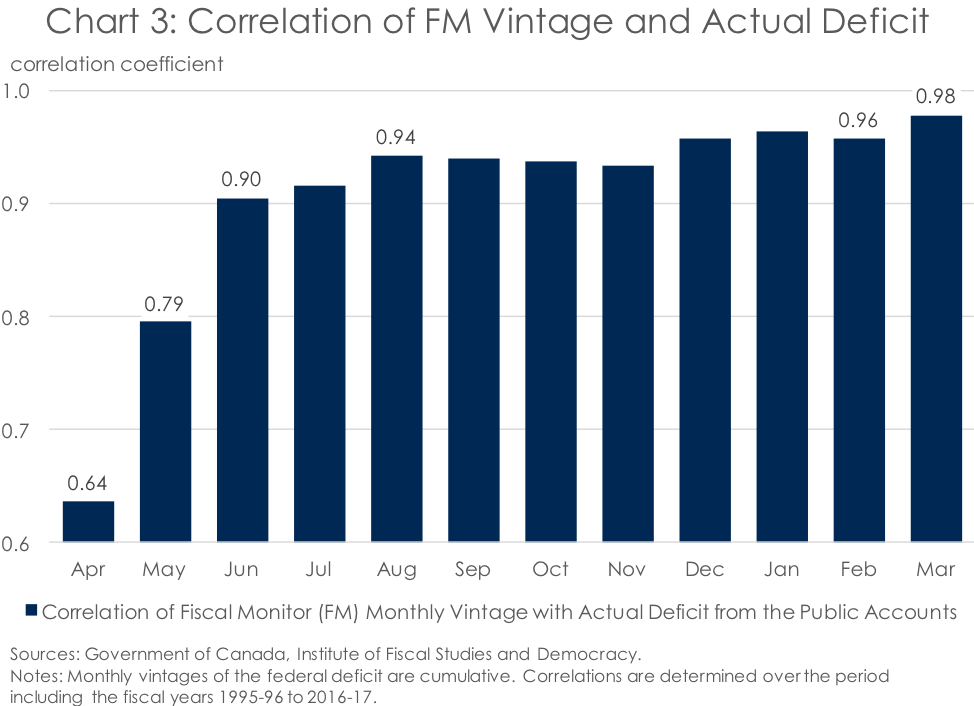
Indeed, there is often debate among fiscal commentators as to when the Fiscal Monitor begins to provide a relevant estimate of the ultimate budget deficit that the federal government will publish. While somewhat difficult to get an accurate point estimate of the budget deficit from the Fiscal Monitor due to end-of-year accrual adjustments, even just a few of months of data can provide a reasonable estimate. As such, while the fit of the cumulative deficit broadly improves with each new month of Fiscal Monitor data, the improvements become incrementally minor following the June Fiscal Monitor vintage (Chart 3).
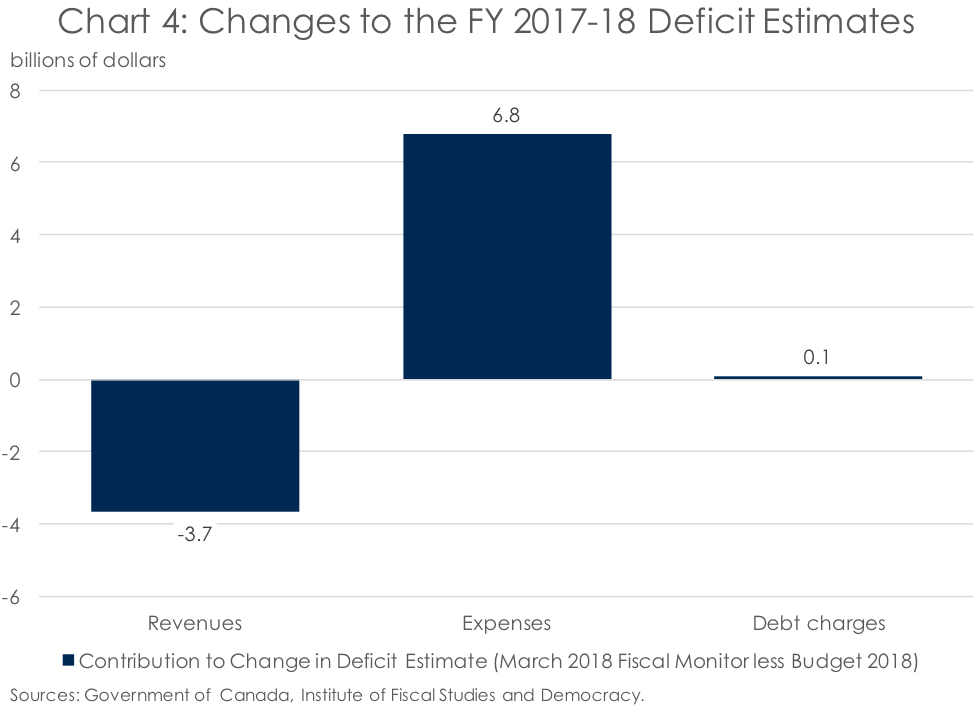
But just because budget deficit estimates in two different documents are similar doesn’t mean that they are the same. Indeed, there could be significant differences under the surface that net out to a similar result. And that is what we observe when comparing total revenues, program expenses, and public debt charges in Budget 2018 and the March 2018 Fiscal Monitor (Chart 4). Revenues came in $3.7 billion lower in the Fiscal Monitor than in Budget 2018 for the 2017-18 fiscal year, thereby increasing the size of the deficit. At the same time, program expenses were below expectations by $6.8 billion, supporting a smaller federal deficit. Although this amount does not include the $4.2 billion accrual adjustment for changes to veterans’ pensions announced in Budget 2018, program expenses in the Fiscal Monitor came in below the Budget 2018 forecast regardless. Finally, while the contribution was much smaller, public debt charges also came in below the forecast presented in Budget 2018, saving the federal government about $0.1 billion in fiscal 2017-18.
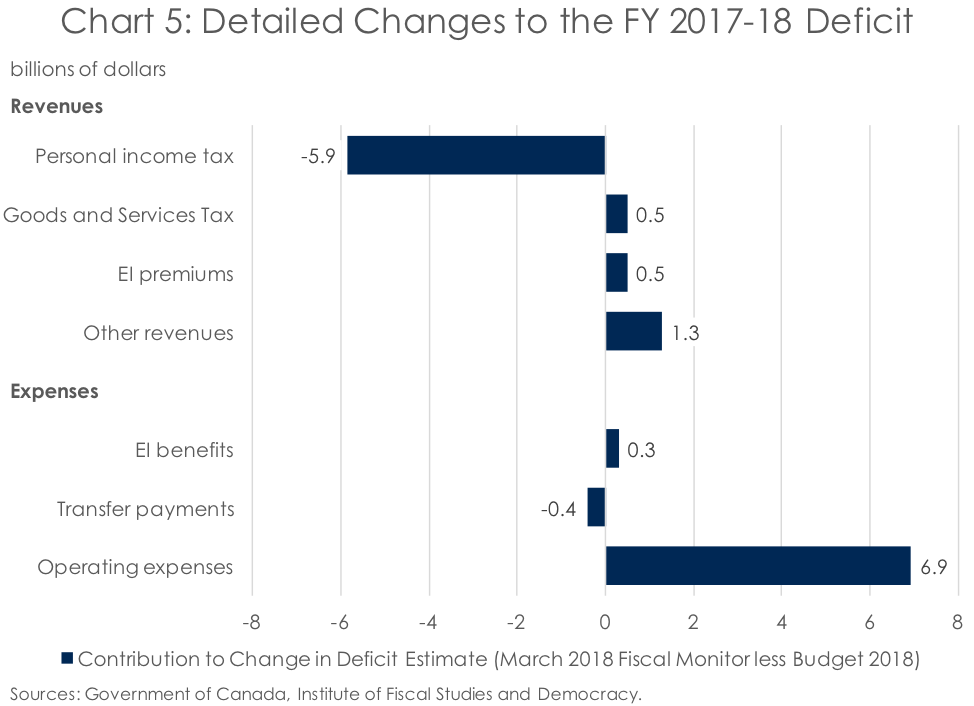
Going further into the weeds reveals that the differences in the March 2018 Fiscal Monitor numbers compared to those in Budget 2018 are very much concentrated in a few areas (Chart 5). Notably, the weakness in revenues relative to Budget 2018 was largely driven by much lower Personal Income Tax (PIT) revenues, to the tune of $5.9 billion in the 2017-18 fiscal year. Compare that with the other revenues categories, which have largely come in on the upside, thereby contributing to a smaller deficit. Meanwhile, the positive contribution from lower spending is almost entirely concentrated in Operating Expenses – the discretionary part of federal government spending associated with federal departments, the programs they administer, and the compensation of the federal employees who deliver those programs. The March 2018 Fiscal Monitor estimated that this area of spending came in $6.9 billion lower than that was in Budget 2018. Also notable is that Employment Insurance (EI) premium revenue was more elevated in the March 2018 Fiscal Monitor than expected while EI benefits came in below expectations. This led to a reduction in the budget deficit thanks to a bump in the EI Operating Account annual balance of $0.8 billion in fiscal 2017-18 relative to Budget 2018.
It’s nothing personal, we’re just here for your taxes
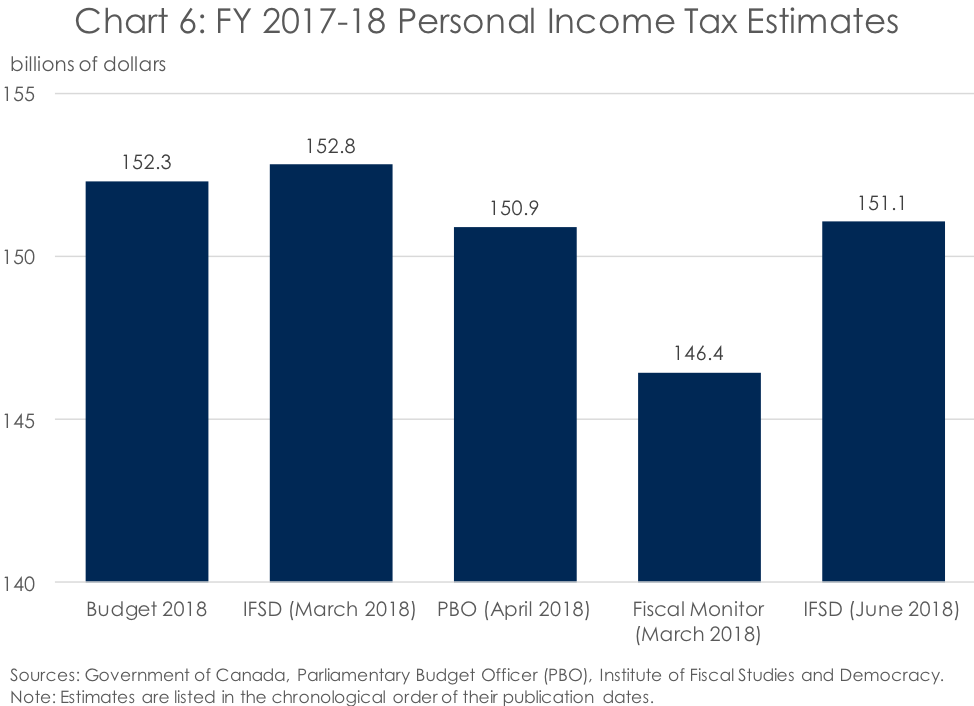
Looking first to the 2017-18 fiscal-year estimate of PIT revenue in the March 2018 Fiscal Monitor, it quickly becomes clear that it is very much out of step with the estimates of other forecasters (Chart 6). At $146.4 billion, it is $4.5 below the next closest estimate that the Parliamentary Budget Officer (PBO) published in April. Indeed, incorporating the latest economic data through the first quarter of 2018 has brought down the IFSD’s forecast of PIT revenues in fiscal 2017-18 to a level very similar to that published by the PBO and well above the Fiscal Monitor estimate.
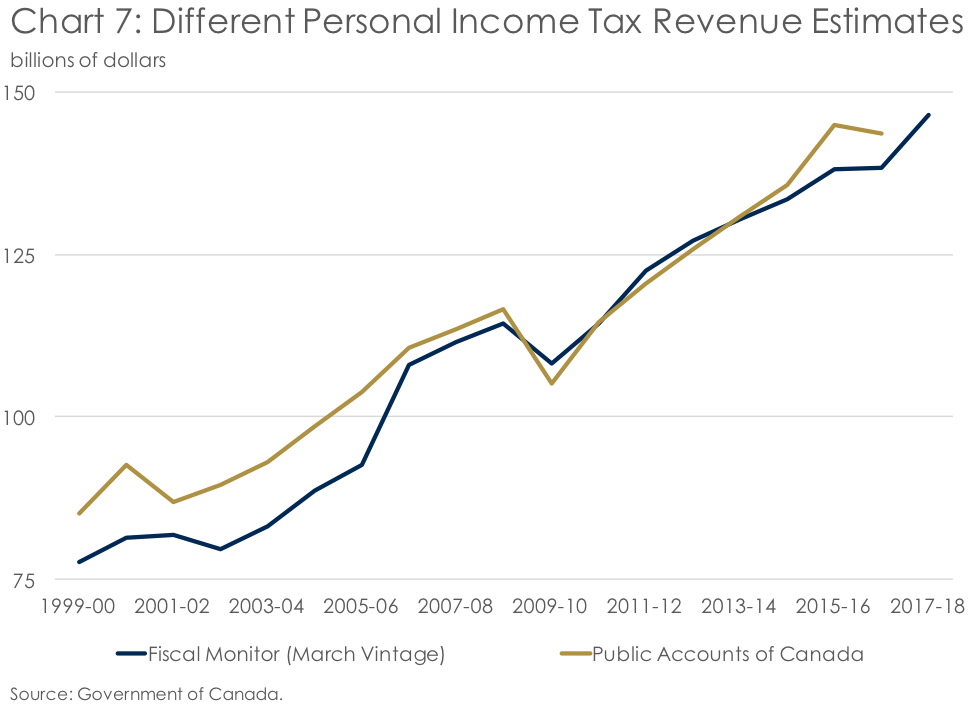
Of course, a difference of this magnitude requires some explanation. And that explanation is that the March vintage of the Fiscal Monitor generally underestimates the level of in-year PIT revenues (Chart 7). Over history, this underestimate has averaged about 5% annually, although the average has been closer to 2.5% in recent years, possibly as a reflection of more timely electronic filing. Notably, an upside surprise on PIT revenues in the Public Accounts of Canada relative to the Fiscal Monitor is even more likely when the output gap is positive, which occurs when the level of real output of an economy is above its trend. And a positive output gap is estimated to be the case now, according to the IFSD’s most recent Canadian Economic Forecast. As such, it’s a fair bet that PIT revenues will be higher for the 2017-18 fiscal year when the Public Accounts of Canada are published later this year than they were in the March 2018 Fiscal Monitor.
The federal government is a smooth operator, especially when it comes to spending
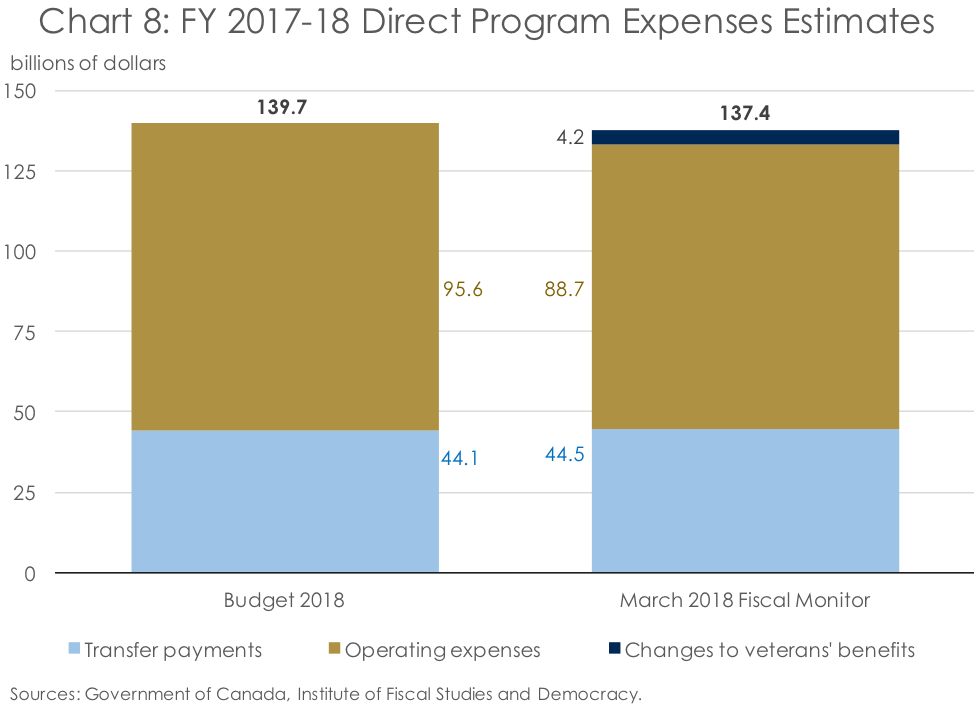
The other major category where the Budget 2018 forecast was a major departure from that presented in the March 2018 Fiscal Monitor was in operating expenses for the 2017-18 fiscal year. As was mentioned previously, the most recent estimate was lower to the tune of $6.9 billion. However, this does not include the $4.2 billion accrual adjustment for changes to veterans’ benefits. Netting this off gets you to an improved operating expense estimate for the 2017-18 fiscal year of $2.7 billion. Combining this with a slightly higher fiscal 2017-18 outlook for transfer payments in the Fiscal Monitor relative to Budget 2018 ($44.5 billion versus $44.1 billion) results in a total Direct Program Expenses (DPE) forecast which is $2.3 billion lower than in the budget (Chart 8).
Unfortunately, it is at these highly aggregated spending levels that the comparison between discretionary spending in Budget 2018 and the March 2018 Fiscal Monitor end. This is because Budget 2018 only provided two spending categories under DPE: transfer payments and operation expenses. Meanwhile, the March 2018 Fiscal Monitor provided a breakdown of transfer payments by six large federal departments and an ‘Other’ line for the remainder, while operating expenses are broken out into Consolidated Crown Corporations, National Defence, and ‘All other departments and agencies’. The difference in the level of detail between Budget 2018 and the March 2018 Fiscal Monitor is important because it means little scrutiny can be done on why the headline DPE spending numbers differ.
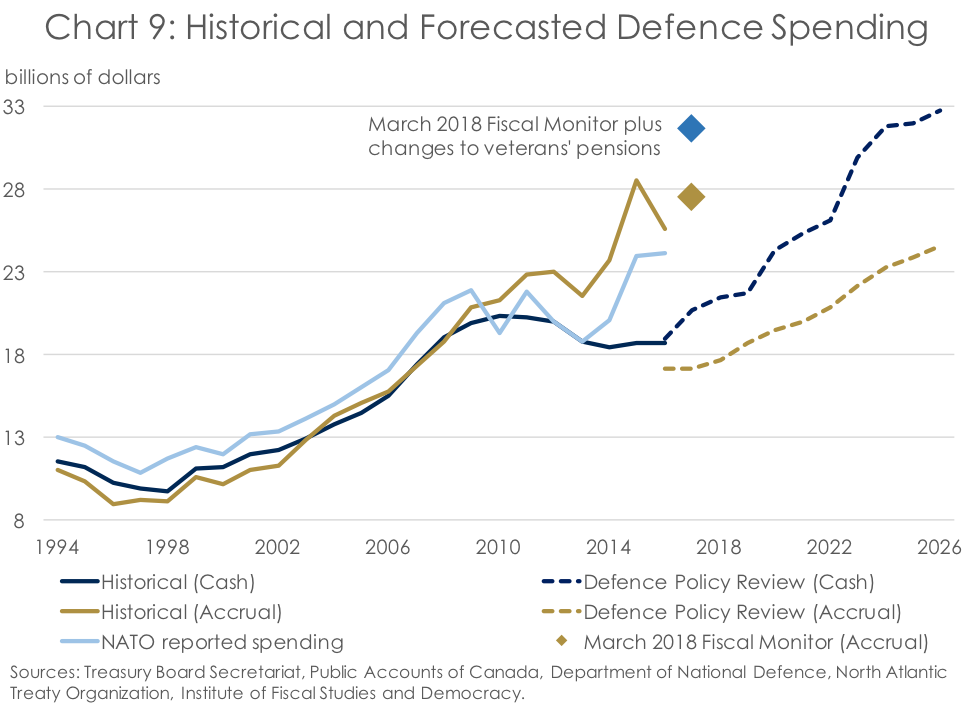
Take spending by the Department of National Defence (DND) as an example. In the spring of 2017, DND published the Defence Policy Review (DPR), which laid out the forecast for Canadian defence spending for the coming two decades. While useful on a cash basis, the fact that there was a yawning gap between the accrual-based spending estimates in the Public Accounts of Canada and the DPR mean that the federal government’s forecast for defence spending is of limited usefulness. Chart 9, taken from the IFSD’s recent note Is Defence Spending on Target or is the Federal Government Shooting Blanks?, illustrates this clearly. In the 2016-17 fiscal year, a year for which we have full information, the difference between the accrual-based defence spending estimates in the Public Accounts and DPR was $8.4 billion. Using the March 2018 Fiscal Monitor defence spending estimate for fiscal 2017-18, this gap widened to $10.3 billion. And adding the accrual adjustment for the changes to veterans’ pensions would have widened this gap even further to $14.5 billion in the 2017-18 fiscal year. As such, it has become apparent that the DND has likely not included pensions and benefits in the forecast for defence spending in the DPR. As a result, the DPR is of little help in forecasting defence spending in Canada, making it a challenge to forecast operating expenses as a whole.
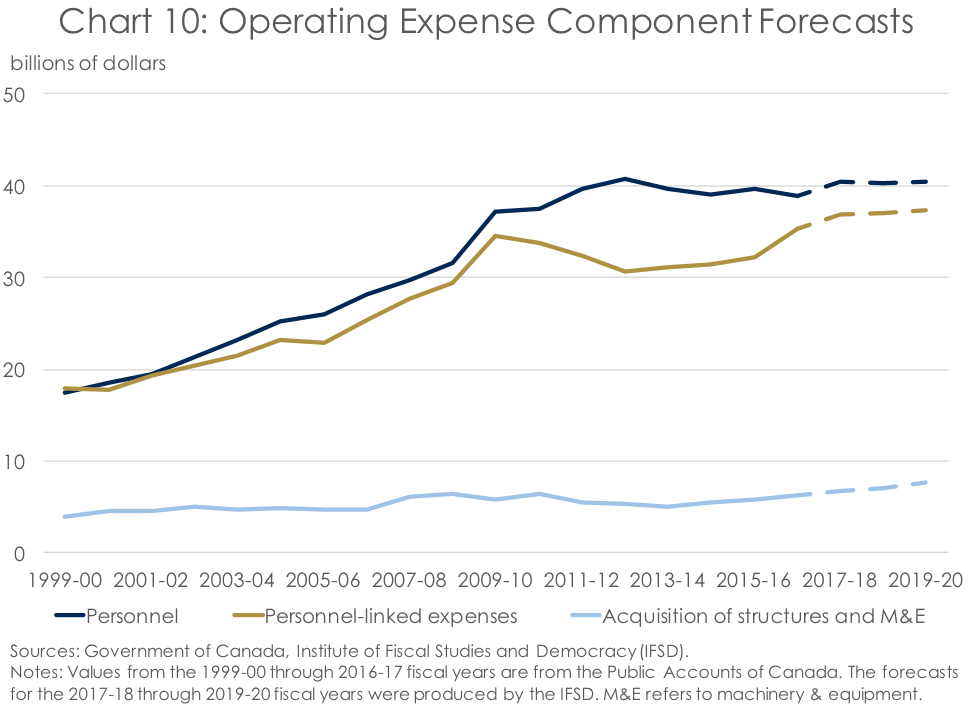
Given the difficulty in forecasting DPE based on the information provided in federal government budget documents, in February 2018 the IFSD developed an alternative approach to forecasting discretionary spending. Entitled Budget Spending Blackbox: Building a Bottom-Up Federal Expense Forecast, the report outlined how the IFSD used historical personnel costs provided by the Receiver General, forecasted full-time equivalents from federal Departmental Plans, and other information from the Government of Canada to forecast the cost of public servants over the next three years (Chart 10). We then forecasted both personnel-linked expenses (such as maintenance and utilities) and capital costs to get a get a bottom-up forecast for operating expenses. The PBO went through a similar exercise of forecasting federal personnel spending in March 2018. Unfortunately, as the PBO refused to share information with Parliamentarians on the federal Department of Finance’s forecasts for pension accruals, it is difficult to know why the forecasts for personnel costs may differ between the PBO and IFSD. The PBO also refused to release information provided to it by the Department of Finance on downward revisions to the outlooks for various federal departments, which freed up nearly $16 billion in additional fiscal room over five years in Budget 2018 (see the IFSD’s March 2018 Federal Fiscal Forecast for more information).
Accounting for changes in the Employment Insurance Account
The final area of notable change between Budget 2018 and the March 2018 Fiscal Monitor is in Employment Insurance (EI) premium revenues and benefits. As was mentioned earlier, revenues came in higher and benefits lower than was anticipated at the time of the budget, contributing to a net reduction in the deficit of $0.8 billion in the 2017-18 fiscal year. This means that not only is the EI Operating Account annual balance higher than was previously anticipated, but so is the cumulative balance in the EI Operating Account (Chart 11).
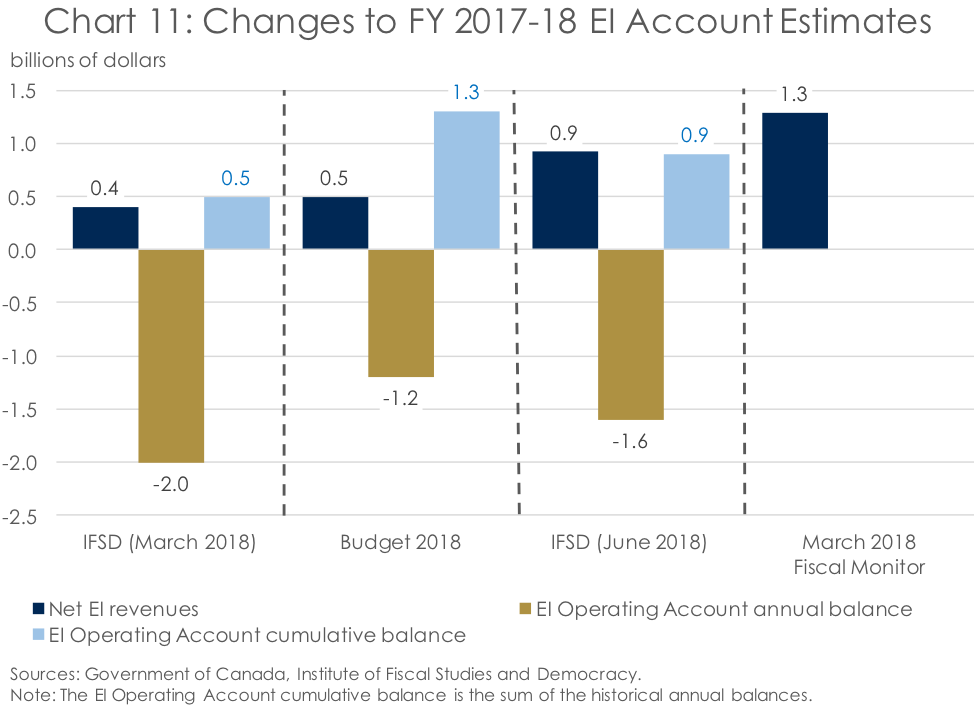
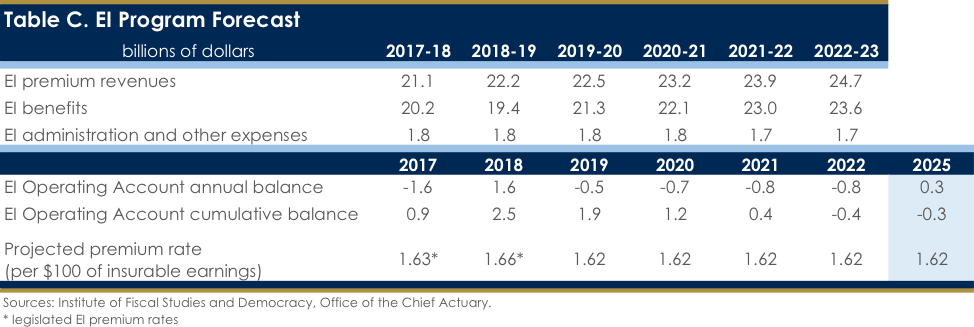
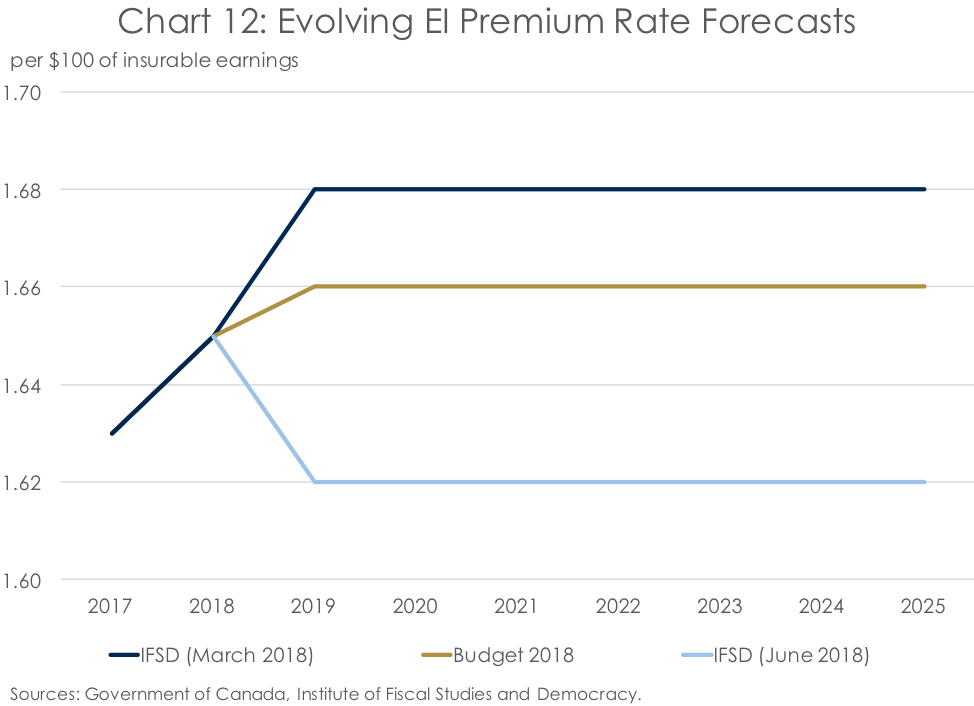
But it’s not just the in-year impact on the deficit that matters in the more optimistic estimate of the EI Operating Account annual balance in the 2017-18 fiscal year. Instead, it is the fact that the cumulative balance in the EI Operating Account moved even further into positive territory than was previously expected. With the EI Operating Account designed such that the EI premium rate is set at a level which will cause the cumulative balance to fall to zero after seven years, the IFSD has revised down its outlook for the EI premium rate considerably. Instead of the $1.68 per $100 of insurable earnings projected in March 2018, the IFSD is now projecting that the more positive labour market and income growth forecasted in its June 2018 Canadian Economic Forecast will allow for the EI premium rate to be set at $1.62 per $100 of insurable earnings (Chart 12). This is also below the EI premium rate of $1.66 per $100 of insurable earnings used to determine the EI premium revenues forecast in Budget 2018.
What do all of these changes mean?
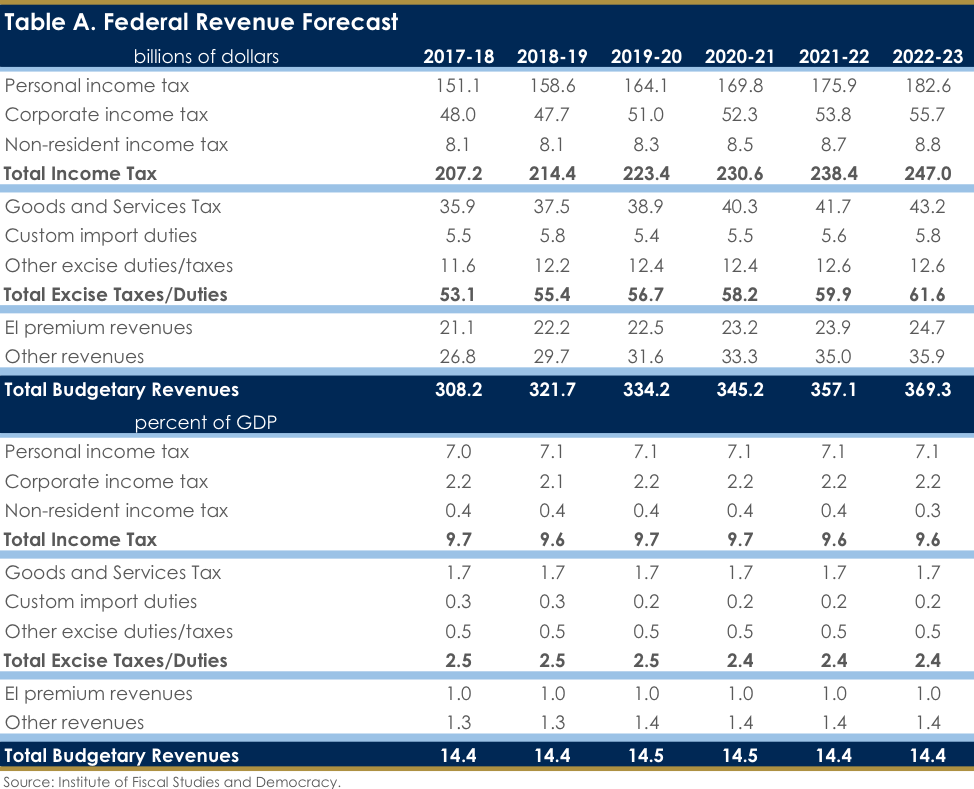
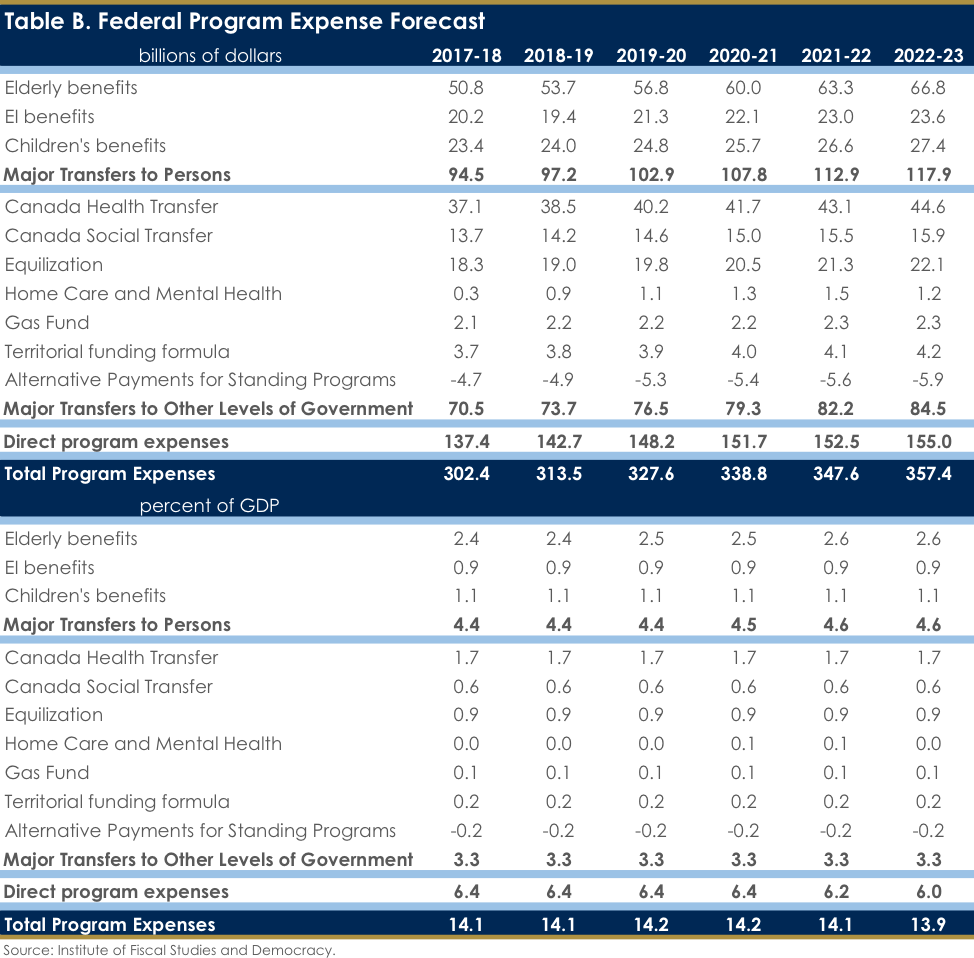
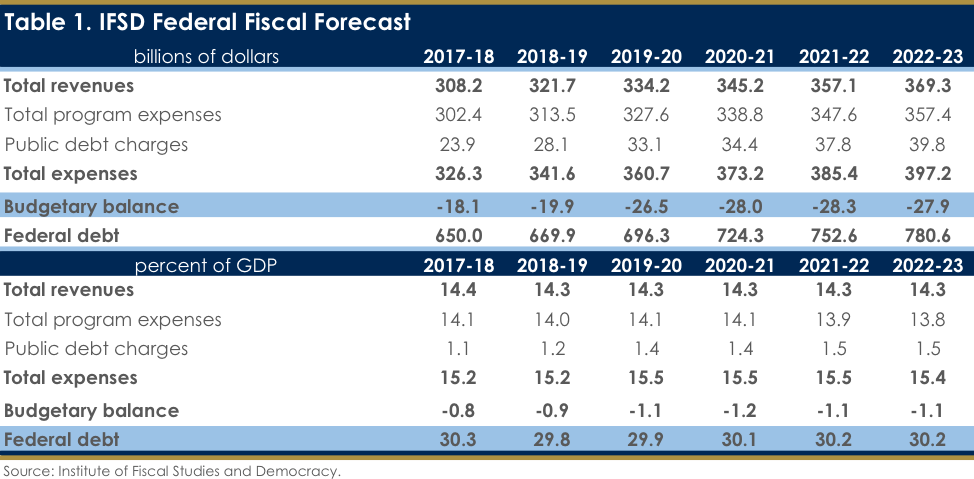
As Chart 1 illustrated, at the end of the day, the IFSD’s June 2018 federal budget deficit forecast is not a significant departure from that published in March. While the outlook for deficits has improved somewhat, they remain large and the debt-to-GDP ratio will be little changed over much of the forecast (Table 1). (For the IFSD’s more detailed revenue and expense forecasts, see Tables A through C.)
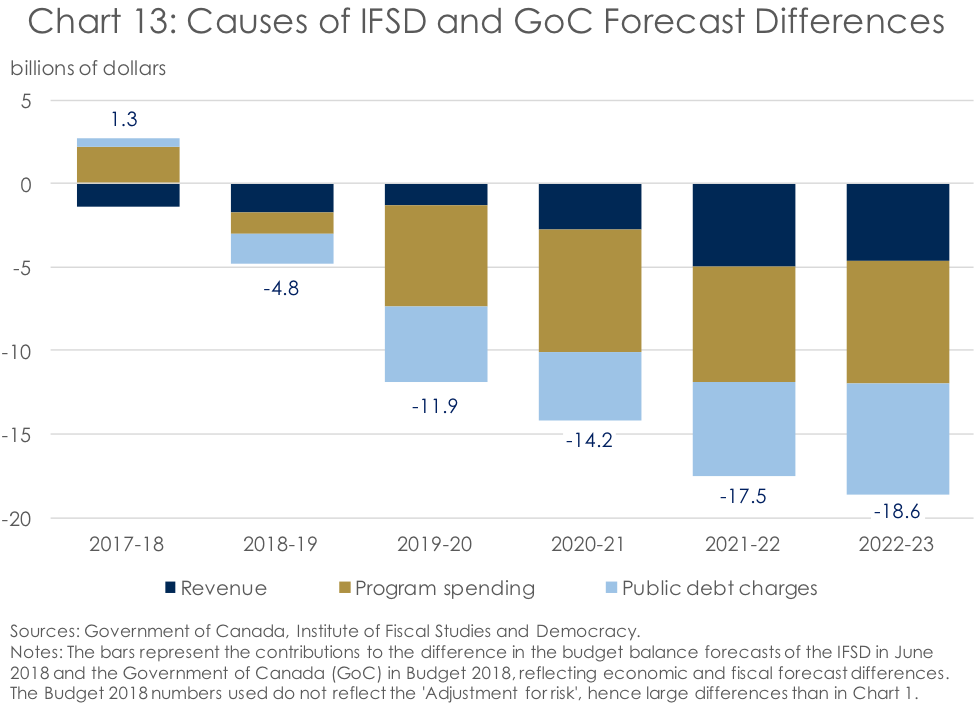
Budget 2018 presented an outlook for gradually shrinking deficits over the next five years. But at the IFSD, we are not quite so optimistic. Instead, our outlook is for lower revenues and higher program expenses beyond 2017-18, leading to lower primary surpluses (revenues less program expenses). These lower primary deficits mean larger deficits once interest payments are made, thereby requiring more borrowing and, hence, greater public debt charges. All of these differences in the IFSD outlook relative to Budget 2018 contribute in roughly similar proportions to the IFSD’s larger budget deficit by the 2022-23 fiscal year (Chart 13).
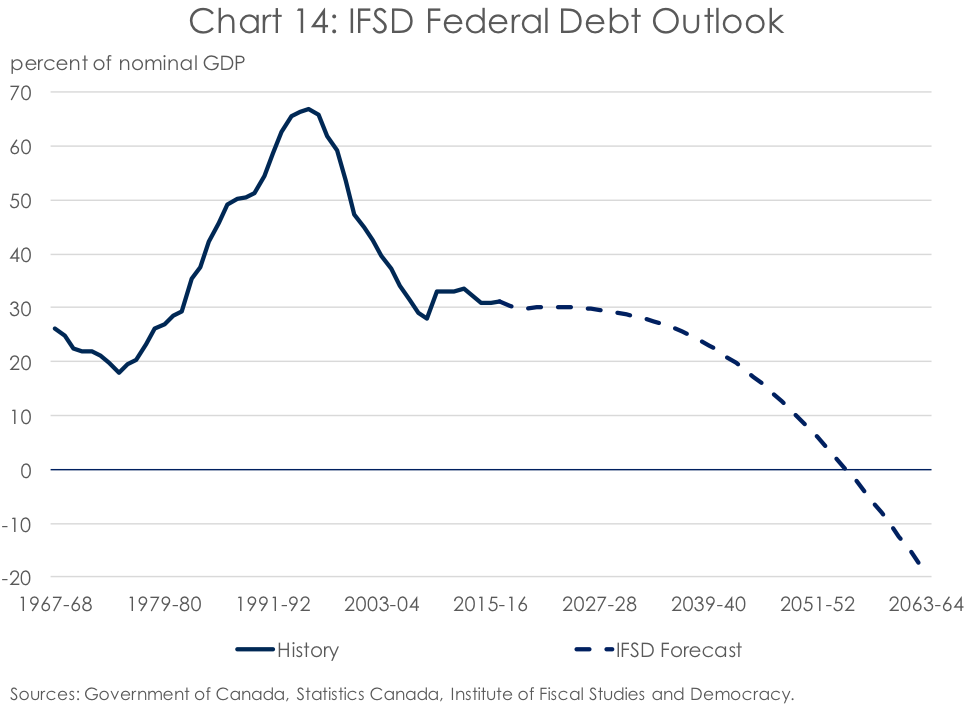
This vicious cycle is expected to cause the federal debt (accumulated deficit) to rise at a similar pace as nominal GDP, thereby leaving the debt-to-GDP ratio broadly unchanged from its 2017-18 level over much of the forecast. Meanwhile, the federal government is projecting a steady and gradual decline in the debt-to-GDP ratio. But it is important to note that, even when using the IFSD’s more pessimistic outlook for federal finances, it in no way signals the beginning of some sort of federal debt crisis. Given the current policies in place, the federal government is expected to begin to see its debt fall as a share of the economy toward the end of the medium-term forecast presented in Table 1 (Chart 14). This implies that the federal government is currently in a fiscally sustainable position.
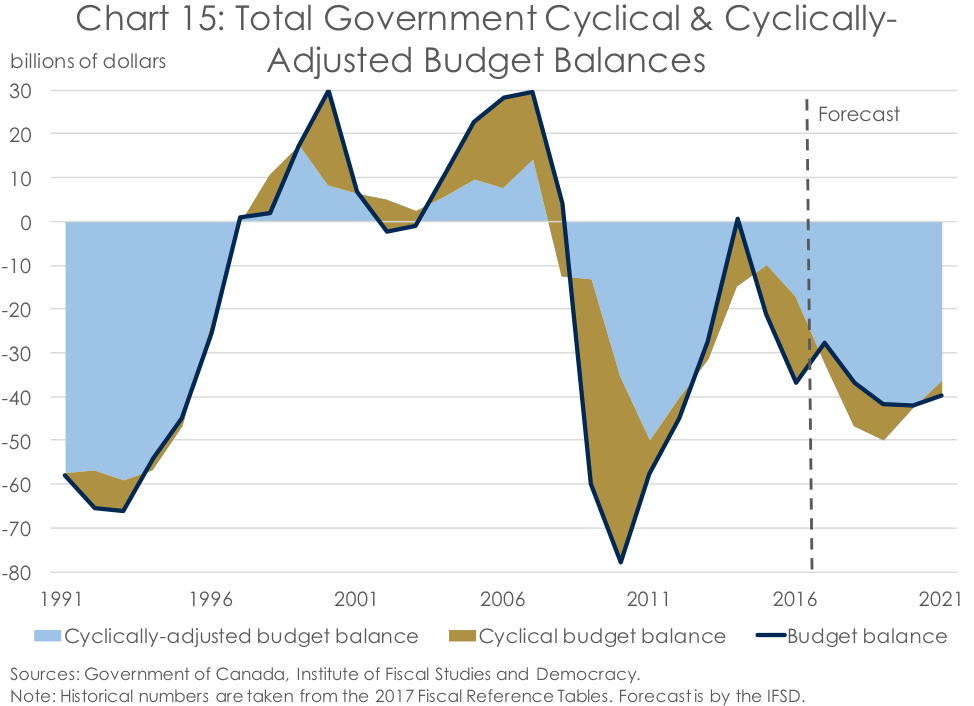
But the Government of Canada should not become complacent. As the IFSD noted in our Fiscal Sustainability Report 2017, the federal government really only finds itself in a fiscally sustainable position because it dramatically reduced the rate at which the Canada Health Transfer (CHT) will grow going forward. Without this change, the federal government would be in fiscal trouble. And it is with this fiscal room in hand that the federal government has run large deficits at a time when the economy is running above potential. However, the good times won’t last. Indeed, the Bank of Canada has already begun raising interest rates to help cool the Canadian economy. It also means that the deficits the federal government is running and planning to run are structural in nature, as is the total government (federal, provincial, local, and Aboriginal) deficit. Indeed, taking the budget balance forecasts published during this year’s budget season and combining them with the IFSD’s Canadian Economic and Federal Fiscal Forecasts lead to an estimated cyclically-adjusted budget balance on par with that which the federal Department of Finance estimates occurred during the Great Recession (Chart 15). Of course, as the economy has grown since 2009, the size of the structural deficit is smaller as a share of the economy today than it was then. But this still begs the question: Why run large structural deficits today when we know that the good times will eventually come to an end, thereby putting debt sustainability in the future in jeopardy?
Conclusion
While the March 2018 Fiscal Monitor signalled a modest improvement in the outlook for the budget deficit in the 2017-18 fiscal year, the IFSD is expecting deficits to move higher over the remainder of the forecast. This stands in stark contradiction to the forecasts published in Budget 2018. And while these deficits aren’t likely to jeopardize the federal government’s current sustainable fiscal stance, these persistent structural deficits could put the government in a tight spot if the economy takes a turn for the worse. As such, we continue to advocate for the federal government exercising some prudence in its fiscal planning and putting itself on a clear path to return to balance.