
by Randall Bartlett
To most readers, the topic of pricing infrastructure assets no doubt precedes to onset of a good night’s sleep. Concepts such as internal rate of return, amortization, economic forecasts, and risk premiums are enough to make even the most interested observer begin to nod off. However, in the context of the planned introduction of the Canada Infrastructure Bank (CIB), it is worth putting these concepts to use, as even a simple application of these ideas is important to evaluating the merits of the CIB.
What follows is an illustrative example of how an infrastructure asset is priced. To be clear, I am not advocating for public over private ownership of infrastructure assets, although their pseudo-public good status discussed in a prior blogpost suggests that governments may have a larger role to play in infrastructure than in other markets. I am also very supportive of mechanisms that allow for price discovery, such that infrastructure assets are valued correctly and the burden of paying for the construction, operation, and maintenance of these assets primarily falls on the people who use them. Instead, the intent of this example is to pull back the curtain, if only a little, on infrastructure valuation for non-experts. It also demonstrates that the higher the required rate of return on an infrastructure investment, the higher the fees that will need to be charged on that asset to meet that required rate of return.
An infrastructure valuation example for Canada
In 2014, the Ontario Ministry of Transport commissioned a pre-feasibility study on building high speed rail between London and Toronto, Ontario, and the example that follows steals generously from its assumptions. For instance, the estimated cost of the project is $2.5 billion. Besides the initial cost, we’ll assume an annual operating and maintenance cost of initially $250 million, the total number of annual rides of 6 million, and a useful life of the asset of 30 years. Meanwhile, the value of capital is assumed to appreciate annually at a rate of nominal GDP growth (3.5%) and maintenance costs are assumed to advance at the same pace. We’ll also assume that the project is undertaken through a public-private partnership (PPP), so that the cost of designing, building, financing, operating, and maintaining the rail system is the same regardless of who owns it. Finally, as a result of using a PPP, financing is expected to be roughly 200 bps higher than the yield on 30-year Government of Canada bonds, which is currently about 2.25%. Please note that many of these assumptions differ from those in the December 2016 Final Report from the Government of Ontario’s Special Advisor for High Speed Rail and the Preliminary Business Case for High Speed Rail on the Toronto to Windsor Corridor. That said, the similar fare price estimates in this illustrative example relative to these two studies suggest that the simplifying assumptions used here are not unreasonable.
Putting these assumptions together, one finds that the ticket price for a one-way trip between London and Toronto that would initially be required for this project to cover its costs is $45.50 (Chart 1). This is roughly the cost today of a one-way, economy-class ticket on VIA Rail or a refundable ticket on Greyhound Canada. Then, after the first year, the fare price is expected to advance in line with nominal GDP – the same assumption applied to the value of capital and the operating and maintenance cost.
But a 0% return isn’t great, and indeed falls well below the minimum required return of most pension funds in Canada, which is around 6%. So, what would the average fare per trip need to be in this example to reach a 6% return? Assuming ridership doesn’t change, the answer is $72.50 – well above the current cost of taking this route via other methods of transportation (Chart 1). And if the expected return on the project were to be higher and more in line with the return expectations of asset managers when it comes to infrastructure investment – say 10% – the ticket price would need to be even higher.
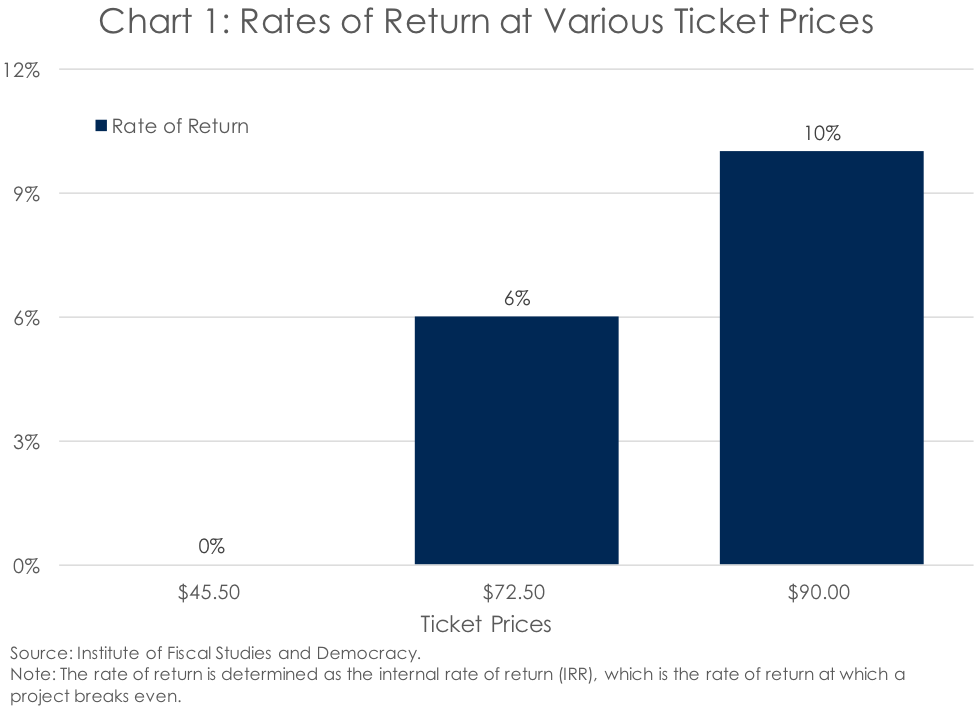
It is worth considering at this point that people would have alternatives to using the high-speed rail, such as taking their car. And it’s well known that as the price of something goes up, people buy less of that more expensive thing. However, in these examples we assumed ridership remains constant. This is a very generous simplifying assumption, as ridership should have fallen when prices rose to $72.50, and then to $90. As such, if ridership was to decline, the fare price would have to rise further to ensure that the minimum return requirements were met.
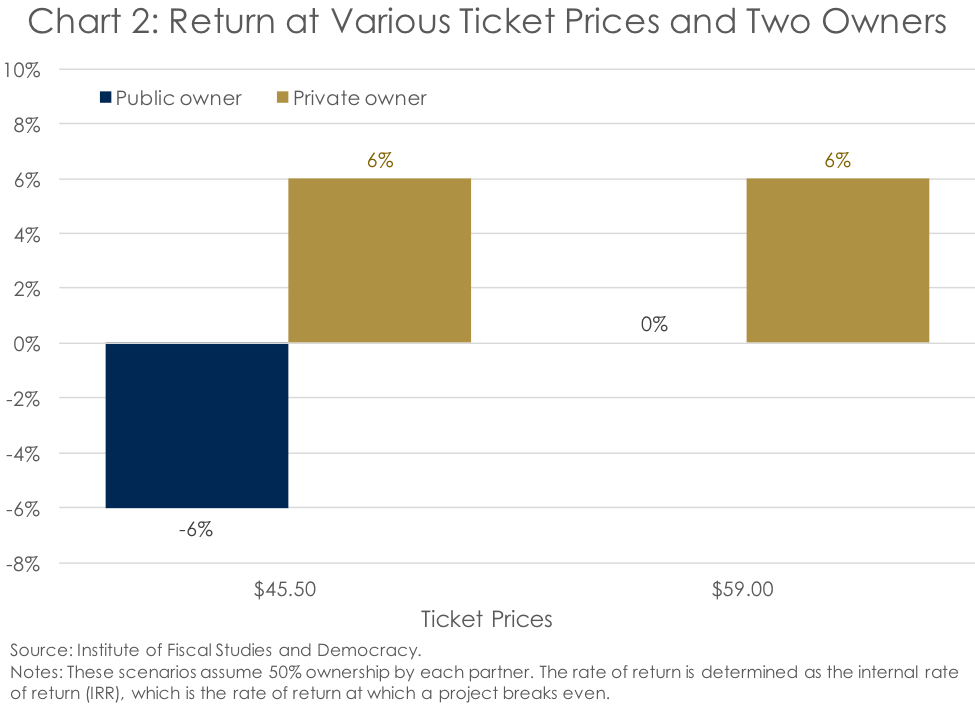
So, let’s now assume a scenario where various levels of government own 50% of the high-speed rail and private investors own the other 50%. If the owners want to set the ticket fare at the breakeven price of $45.50 while ensuring private investors earn a 6% return, this means that the public owners would need to earn an average annual return of -6% – a situation that would likely be unacceptable to taxpayers (Chart 2). Instead, if taxpayers had the expectation that they would at least break even on their investment – a 0% net return – fare prices would need to rise to $59 to ensure investors receive a 6% return. This price is higher than it is for other means of transportation, calling into question the impact on ridership. And, of course, 6% is a minimum return threshold. On a highly illiquid investment with uncertain cash flows like a ‘greenfield’ infrastructure asset, investors should rightly expect a rate of return that is much higher than 6%. Further, while this $13.50 difference in ticket prices will benefit investors, one wonders why it couldn’t be instead used to cut taxes or increase spending if the rail line was wholly publicly owned.
How does this apply to the CIB?
The intent of the CIB is to take a small amount of public capital and crowd in much more private-sector investment for infrastructure. But as the IFSD has stated in past blogposts (see here and here), the rationale given for establishing the CIB seems a bit dubious. First, financing beyond the municipal level is not a major issue. Indeed, according to estimates from the Parliamentary Budget Office, the federal government has fiscal room to spare. Second, documents recently unearthed by the Canadian Press (see here and here) suggest that taxpayers will be shouldering a larger share of the risk of CIB investments than will their private-sector partners. That means the risk-adjusted returns to the taxpayer-owned portion of the revenue-generating assets that fall within the CIB’s mandate will be lower than they will be for private-sector partners. Third, the federal government asserts that more infrastructure be built thanks to the CIB, but cites no evidence of this happening in other jurisdictions with similar investment vehicles. And, finally, as the simple examples above illustrate, taxpayers will pay far more for infrastructure in the end through the CIB than they otherwise would. This is particularly true as markets for infrastructure are not especially competitive, such that the free market will not drive down profits to the point where revenues just cover costs.
So, why the CIB? Private-sector initiative and innovation? Sure, but what are taxpayers willing to pay for it.