
by Dominique Lapointe
Tomorrow, Minister of Finance Bill Morneau will present the Fall Economic Statement (FES) of the Government of Canada. This document is largely considered an opportunity for the federal government to update Canadians on major policies being implemented and the state of the economy and public finances, as well as to announce new measures. And in the FES, a lot attention is generally directed towards the evolution of the fiscal situation, e.g. the budgetary balance and the fiscal outlook, since the release of the Budget earlier in the year.
Following the release of Budget 2017 on March 22, a lot has happened. In a nutshell, economic growth has picked up considerably and interest rates have risen, on the heels of two back-to-back overnight rate hikes by the Bank of Canada (BoC). It is in this context that the Institute of Fiscal Studies and Democracy (IFSD) presents some observations on the debt management strategy of the Government of Canada, a subject of tremendous importance that commonly gathers less attention than headline fiscal figures.
The Debt Management Strategy for 2017-18, presented in Annex 2 of Budget 2017, forecasted that the Government of Canada would borrow $286 billion during this fiscal year. Of this, 86% would be borrowed to refinance matured debt and 14% would be used to finance governmental activities.[1] The proportion of total borrowing made through each of the federal government’s financing options (domestic bonds, Treasury bills, foreign debt and retail debt) and over each maturity (from 3 months to 50 years) is called the financing strategy. The stated objectives of the strategy include (1) meeting the financial needs of the Government of Canada and (2) maintaining a well-functioning Government of Canada securities market.[2] Through this, the BoC operates various borrowing programs, each serving different purposes.[3] Because domestic Treasury bills, marketable bonds, and real return bonds form by far the largest source of financing for the federal government, it is in the context of those programs that the we discuss the debt management strategy.
The Current Environment
Around mid-2016, interest rates across developed markets had reached record or near-record lows (Chart 1). Until recently, German and Japanese 10-year government bond yields were in negative territory, implying that investors were virtually accepting to pay a premium to own those bonds.[4] In its latest Sovereign Borrowing Outlook, the Organisation for Economic Co-operation and Development (OECD) cited several reasons for sustained record-low interest rates. These include reduced inflation expectations, compressed risk and term premium,[5] and a decline in real interest rates (commonly cited nominal interest rates adjusted for inflation). Those factors contributing to lower interest rates are broadly the continuation of a trend initiated several decades ago. The OECD goes further to note that sustained, and even expanded, unprecedented monetary easing policies in 2016, such as negative policy rates and quantitative easing (QE), also played an important role. Indeed, QE programs like those pursued by the U.S. Federal Reserve, the European Central Bank, and the Bank of Japan have contributed to compress domestic yield curves.
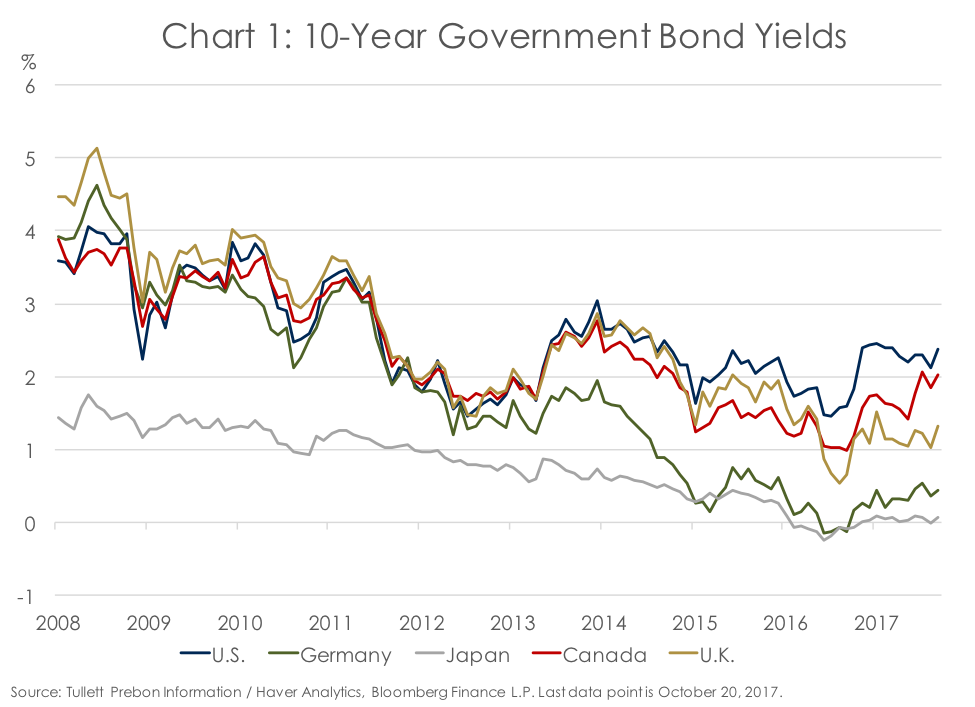
In Canada, the BoC did not have to resort to unconventional policy tools following the 2008-09 recession. It did, however, lower its target for the overnight rate to a near-record low of 0.5% in July 2015 in response to the global oil price meltdown that severely affected oil-producing provinces.[6] However, economic growth in the country began to accelerate in late-2016, as it did around the world, and markets began to anticipate a gradual normalization of global monetary policy. The pickup in real activity stands out in Canada, where real GDP growth averaged 3.7% between 2016Q3 and 2017Q2. That has led many observers, including the IFSD, to estimate that the output gap has been effectively closed. The BoC responded with two back-to-back increases of the overnight rate last summer, driving up rates in the country. (Chart 2).

Recent Developments in Debt Management Strategy
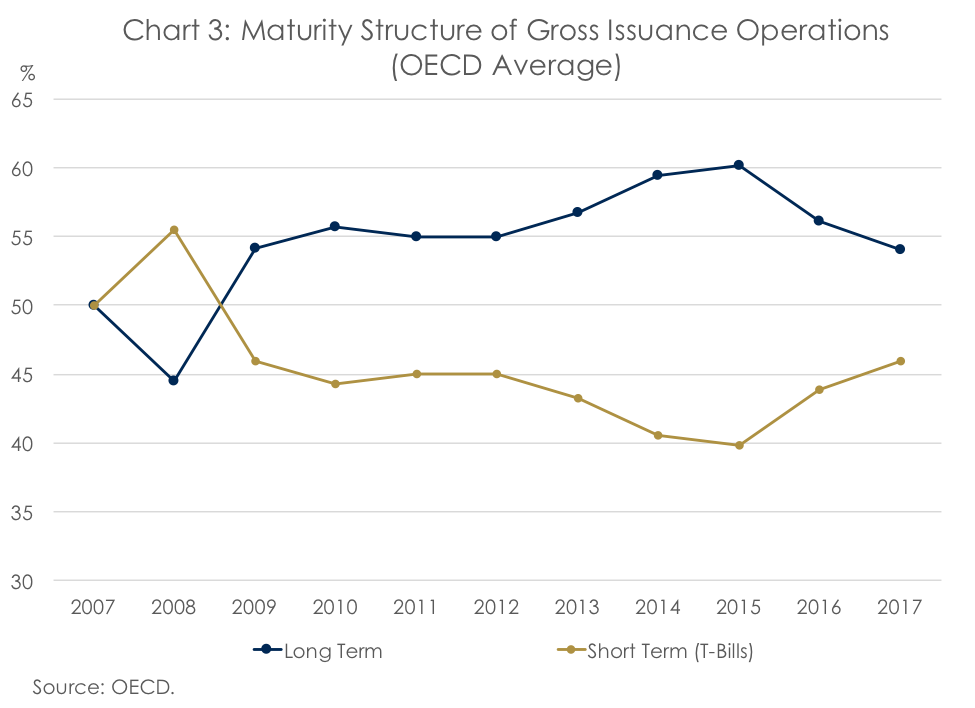
In its Sovereign Borrowing Outlook 2017, the OECD notes that debt managers in many countries have increased their reliance on long-term financing relative to short-term in the last decade (Chart 3). Debt-to-GDP levels have increased refinancing risks. And, therefore, “the prolonged low interest rate environment and flattened yield curves (…) [have eased] the trade-off between expected costs and risk along the efficient frontier in favour of costs.”[7] Reducing costs generally implies issuing more short-term debt (Treasury bills and short-dated nominal bonds, e.g. the “front-end” of the curve) while reducing risks implies issuing more long-term debt (e.g. the “back-end” of the curve). Locking in interest rates for 10, 30, or 50 years with a long-term bond allows a sovereign debt manager to set aside worries about potentially rising interest rates in the years ahead. Furthermore, it reduces the near-term rollover ratio of the debt, as less principal is maturing in the coming years. And, indeed, the trend over the past decade has been toward issuing debt at longer maturities.[8]
Increased reliance on longer-term has debt also manifested itself in the average term-to-maturity (ATM) of sovereign nations (Chart 4). Between 2007 and 2016, across the OECD, the ATM increased by 1.6 years, on average. In December 2016, it stood at 7.8 years. Part of the increase is certainly due to the United Kingdom’s inordinately high ATM of 17.5 years. Already in 2007, the U.K. had the highest ATM among OECD countries, at 14.1 years. The OECD links this unusually high ATM to the inverted yield curve shape for gilts in the U.K. A negative term premium would be embedded in long-dated gilts due to large demand for those securities from institutional investors. The U.K. Debt Management Office (DMO) has therefore capitalized on this demand by issuing more at the very back-end of the curve, with an explicit “bias” towards longer maturities cited in its 2017-18 Debt Management Report.
Relative to the OECD average, the Canada’s debt structure stands out for two reasons. First, contrary to most OECD member countries, Canada’s ATM declined by 0.7 years between 2007 and 2016. Second, while Canada’s ATM was above the OECD average in 2007, it is now 1.5 years below the OECD average, at 6.3 years.

The observations gleaned from Chart 4 are consistent with the Debt Management Strategy for 2017-18 of the Government of Canada. Indeed, the Government expects the average ATM of its domestic debt to “remain relatively stable at around 5.5 to 6.5 years over the medium term”. Moreover, the Strategy reiterates a “focus” on issuing short- and medium-term nominal bonds (2, 3, and 5 years), known as the “belly of the curve”. A reason for this strategy may be liquidity concerns related to increased demand from foreign investors. Building larger benchmarks interest rates[9] across the yield curve is a potential response to those liquidity concerns.[10]
Ultra-Long Bonds: A Reflection of an Evolving Strategy?
Beginning with the 2008 financial crisis and the 2008-09 recession, governments ramped up their issuances of ultra-long government debt (Chart 5). Since then, the volume of issuances of 30- to 50-year nominal bonds has more than doubled. At the same time, issues on bonds with maturities of 50 years or more went from none in 2006 to US$41 billion in 2013, but stabilized at US$28 billion in 2016. Certainly, the extraordinarily low-rate environment created an incentive for governments to issue at those ultra-long maturities.
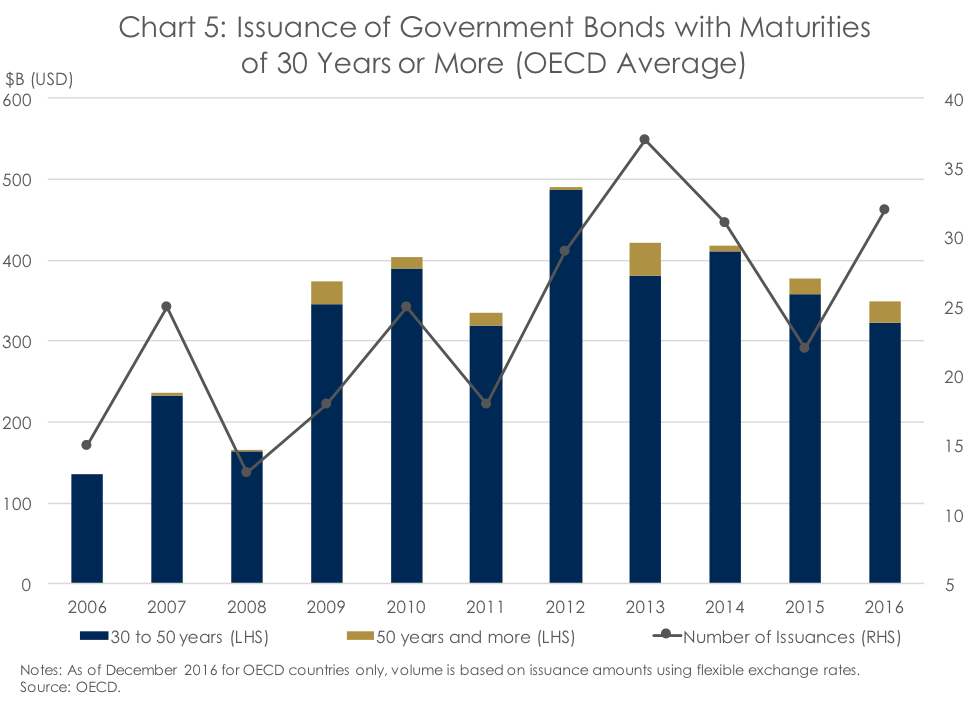

Anecdotes also suggest even more extreme positions. For example, Austria issued a century bond last September.[11] Argentina, where sovereign debt is rated “B” by Standard & Poor’s and Fitch Ratings, issued a century bond in June. Mexico, Ireland, and Belgium also recently issued century bonds, contributing to their respective very high ATMs, highlighted in Chart 4 above.
In Canada, the shift towards longer-term bonds is subtler. The Government did increase its issuance of 30-year nominal bonds between 2009 and 2013, but has since gone back to roughly its pre-recession issuance volumes (Chart 6). Real return bonds volumes increased by $600 million in 2007 but have been stable since.
An interesting development in Canada can be found in the issuance of 50-year Government of Canada bonds. In May 2014, for the first time, the federal government issued a 50-year nominal bond. The government stated in its Strategy that “ultra-long bonds [are issued] on a tactical basis if they are seen to contribute to the Government’s debt strategy objective of stable, low-cost funding and if market conditions are favourable.”
Then, for two years, no new issuance of the series was made. But, in September 2017, things changed and the bond was re-issued for the first time in three years. Moreover, the Department of Finance is “considering” to issue more 50-year bonds, and, ultra-long bonds are one of topics to be discussed in the upcoming Bank of Canada Debt Management Strategy Consultations. While it is premature to call for an overhaul of the Government’s strategy towards ultra-long bonds, those lead the IFSD to believe that ultra-long bonds might play a more important role in the Government of Canada’s Debt Management Strategy going forward. To be fair, the total outstanding amount of Canada’s ultra-long bond is $4.3 billion, less than a third of the benchmark size at the 30, 10 and 5-year tenure.
One drawback highlighted by the OECD to issue more debt towards the back-end of the curve is “regret risk”, where debt managers lock-in interest rates for a very long time and see interest rates falling down even further. In this context, a strategy tilted towards the long-term ends up being costlier. However, as of October 2017, the context is different. For instance, the IFSD forecasts an important upward transition in Canada’s yield curve in the next five years. Three-month Treasury-bill yields are expected to top 3.5% in 2021, as opposed to the 2.3% forecasted in Budget 2017 (Chart 7). Assuming this scenario is realized, debt that can be secured today for as low as 2.0% for 10 years and 2.4% for 30 years will end up being much cheaper than the yields expected in 5 years would imply. This has important implications for the Government of Canada’s finances.

Bottom Line
The IFSD does not expect Canada to radically modify its debt management strategy in the near future. However, considering both the recent dynamic in debt management throughout the OECD, e.g. the lengthening of average terms-to-maturity, and the increasing move toward ultra-long bond issuances, the IFSD believes that a certain shift of strategy, slightly more tilted towards the back-end of the curve, is likely. The renewed interest of the Government of Canada and the BoC for ultra-long debt supports this view. This coincides with the IFSD’s view that a moderate shift in debt issuance strategy from the front-end to the belly, and up to the back-end, of the yield curve might be cost-effective in the future. Under this scenario, the Government of Canada could potentially benefit in the long-run from the current record low-level era of interest rates.
Developments in the Government of Canada’s debt management strategy will closely be followed by the IFSD going forward. Meanwhile, the Institute is also working toward building a Government of Canada debt-strategy model, as developed and used by the Bank of Canada, that provides optimal debt issuance strategy with even more precision.
[1] See table A2.1 of the Annex for a complete breakdown of borrowings for 2017-18, as well as a description of financial sources/requirements.
[3] See the latest Summary of Government of Canada Direct Securities and Loans for a complete list of each borrowing program and their respective characteristics.
[4] As of December 2016, up to US$ 10 trillion in government bonds, representing in some cases more than 80% of total outstanding debt in some countries, were negatively yielding. Countries including France, Switzerland, Sweden, Norway, among others, also had negative yielding government bonds. See Chapter 2 of the OECD 2017 Sovereign Borrowing Outlook for more details.
[5] Inflation expectation is defined as the expected inflation over the time-to-maturity of the bond. Investors usually require higher nominal yield to compensate for the deteriorating effect of inflation on purchasing power. The risk premium generally refers to taxation, liquidity and credit risks imbedded in a specific bond that require yield compensation. The term premium refers to the yield premium investors usually require for lending money over a longer period of time.
[6] The BoC lowered its target for the overnight rate to a record low of 0.25% in March 2009 in the midst of the 2008-09 recession.
[8] In 2016 and 2017, this trend changed slightly, as the share of Treasury-bill financing in total financing ticked up. The OECD explains that this increase is largely due to the decision in May 2015 by the U.S. Department of Treasury to raise its liquidity buffer (the cash balance of the Government) by issuing more Treasury bills from 2015 to 2017. The Department of Treasury noted, however, that this “should not be viewed as a change in its strategy of extending the weighted average maturity of the debt”.
[9] The reference rates over which other yields are calculated.
[10] Among other things, to alleviate liquidity concerns, the BoC also lowered its share of buying at auctions from 20% to 15%. See the 2016 OECD Survey on Primary Markets Developments for more details.